Unlock a world of possibilities! Login now and discover the exclusive benefits awaiting you.
- Qlik Community
- :
- All Forums
- :
- QlikView App Dev
- :
- Re: Generate new Dimension from different columns
- Subscribe to RSS Feed
- Mark Topic as New
- Mark Topic as Read
- Float this Topic for Current User
- Bookmark
- Subscribe
- Mute
- Printer Friendly Page
- Mark as New
- Bookmark
- Subscribe
- Mute
- Subscribe to RSS Feed
- Permalink
- Report Inappropriate Content
Generate new Dimension from different columns
Good morning,
I am stucked with the following task:
In a table I have 5 columns:
a) Project ID
b) Invoice Date 1
c) Invoice Value 1
d) Invoice Date 2
e) Invoice Value 2
I would like get a bar chart, depicting
dimension: all invoice dates from columns b and d
formula: all invoice values from colomns c and e
I thought to generate two new columns "Invoice Date All" and "Invoice Value All" while loading the table.
Any idea how to put this in the script?
Any help is highly appreciated.
Michael
- Tags:
- qlikview_scripting
- Mark as New
- Bookmark
- Subscribe
- Mute
- Subscribe to RSS Feed
- Permalink
- Report Inappropriate Content
Hi,
Have you think in concatenating the values to create a table with:
a) Project ID
b) Invoice Date
c) Invoice Value
Saludos.
- Mark as New
- Bookmark
- Subscribe
- Mute
- Subscribe to RSS Feed
- Permalink
- Report Inappropriate Content
May be this?
Load [Project ID], [Invoice Date 1] as [Invoice Date All], 'Date 1' as Flag, [Invoice Value 1] as [Invoice Value All] From Table;
Join // Inner Join
Load [Project ID], [Invoice Date 2] as [Invoice Date All], 'Date 2' as Flag, [Invoice Value 2] as [Invoice Value All] From Table;
- Mark as New
- Bookmark
- Subscribe
- Mute
- Subscribe to RSS Feed
- Permalink
- Report Inappropriate Content
HI Michael,
I think Federico's idea is worth trying. Something like:
Table:
Load
[Project ID]
[Invoice Date 1] as [Invoice Date]
[Invoice Value 1] as [Invoice Value]
From ...
Load
[Project ID]
[Invoice Date 2] as [Invoice Date]
[Invoice Value 2] as [Invoice Value]
From ...
Regards
Andrew
- Mark as New
- Bookmark
- Subscribe
- Mute
- Subscribe to RSS Feed
- Permalink
- Report Inappropriate Content
H Anil,
your suggestion worked perfectly well. Really great help.
Thank you very much!
Michael
- Mark as New
- Bookmark
- Subscribe
- Mute
- Subscribe to RSS Feed
- Permalink
- Report Inappropriate Content
Hi Frederico,
Thank you for your feedback.
I tried your suggestion, but it did not work properly if I had to use more that two columns (Invoice Date 1; Invoice Date 2 ... Invoice Date 4)
It allows loading the values even with 4 Inovice dates correctly (checked in a table box).
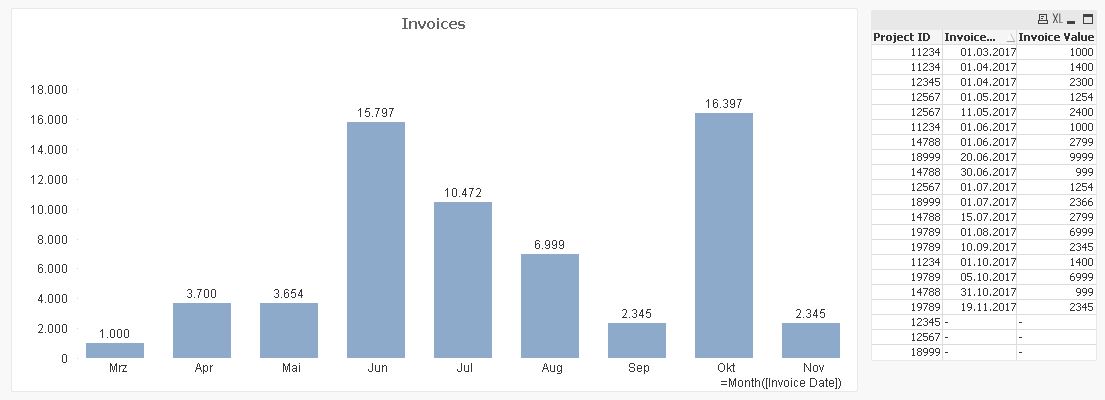
But if I set up a bar chart in which I use Month([Invoice Date]) as a dimension, and sum([Invoice Value]), in each month that has more than two values the sums are not calculated properly (see month June, July, Oct.)
Only months in which I do have 1 or 2 entries are shown correct values. (Please see screen shot).
The suggestion by Ani to use "inner join" worked in this setting very well.
Kind regards
Michael
- Mark as New
- Bookmark
- Subscribe
- Mute
- Subscribe to RSS Feed
- Permalink
- Report Inappropriate Content
Hi Frederico, Hi Andrew,
I recheck my script, and I figure out why the bar chart did not show the correct values.
Rather stupid mistake.
I can now say that your suggestion to concatenating the data in a table works also perfectly well.
Sorry for any confusion.
And many thanks to you for helping out.
Michael