Unlock a world of possibilities! Login now and discover the exclusive benefits awaiting you.
- Qlik Community
- :
- All Forums
- :
- QlikView App Dev
- :
- How to calculate % in the table of chart propertie...
- Subscribe to RSS Feed
- Mark Topic as New
- Mark Topic as Read
- Float this Topic for Current User
- Bookmark
- Subscribe
- Mute
- Printer Friendly Page
- Mark as New
- Bookmark
- Subscribe
- Mute
- Subscribe to RSS Feed
- Permalink
- Report Inappropriate Content
How to calculate % in the table of chart properties.
I am trying to calculate the percentage ,i am not able to sum the values of the Grand total because it is the expression in the chart option.The expression for grand total is: count({<CategoryDefect={'Application','User Training','Environment','App Config','Scope Change','Duplicate'}>}CategoryDefect).The Grand Total value is not static value it will change according to the selection of product line.
I have uploaded the excel sheet of the table that i want to be displayed .
Thanks.
- Tags:
- qlikview_scripting
- Mark as New
- Bookmark
- Subscribe
- Mute
- Subscribe to RSS Feed
- Permalink
- Report Inappropriate Content
Hi,
may be like this.
Regards
ASHFAQ
- Mark as New
- Bookmark
- Subscribe
- Mute
- Subscribe to RSS Feed
- Permalink
- Report Inappropriate Content
Hi Ashfaq,
Thanks for your it is working now but how to add this percentage at the bottom also.
Application,User Training,etc etc ...
ex. 7/27 % ,4/27
- Mark as New
- Bookmark
- Subscribe
- Mute
- Subscribe to RSS Feed
- Permalink
- Report Inappropriate Content
Hi Nishika,
Just go to the Chart's properties.
Select the Grand Total expression in expression tab,then check the "Relative" check box for the GRAND Total expression.
- Mark as New
- Bookmark
- Subscribe
- Mute
- Subscribe to RSS Feed
- Permalink
- Report Inappropriate Content
Hi,
May be like this.
Regards
ASHFAQ
- Mark as New
- Bookmark
- Subscribe
- Mute
- Subscribe to RSS Feed
- Permalink
- Report Inappropriate Content
Hi,
I need row at the bottom for % .Please find the attached screen shot.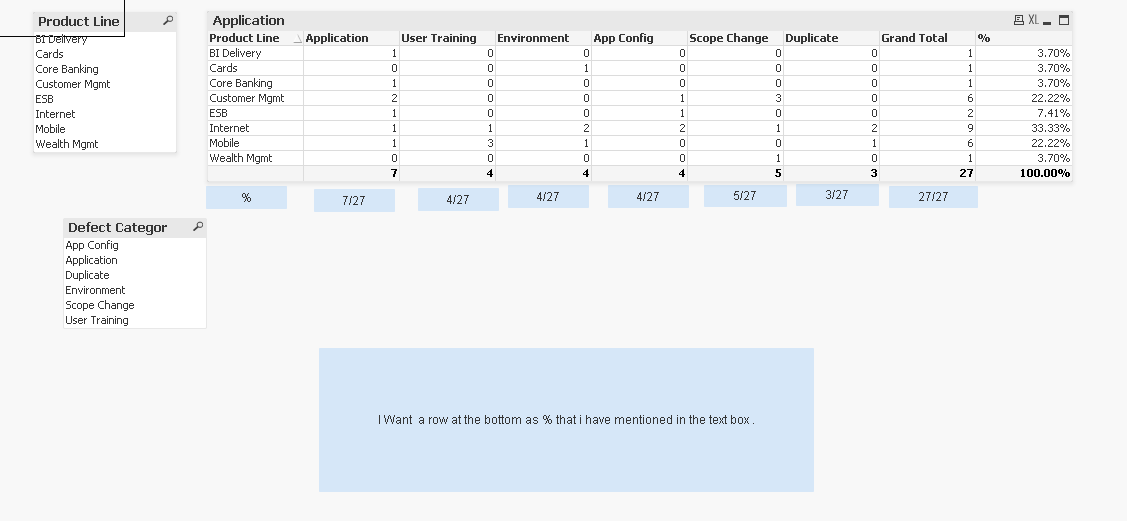
- Mark as New
- Bookmark
- Subscribe
- Mute
- Subscribe to RSS Feed
- Permalink
- Report Inappropriate Content
Hi,
One of the work around could be like this.
Regards
ASHFAQ
- Mark as New
- Bookmark
- Subscribe
- Mute
- Subscribe to RSS Feed
- Permalink
- Report Inappropriate Content
hi,
this is how you can do it. if u want i can attach QVw.
regards
harshal sonone
- Mark as New
- Bookmark
- Subscribe
- Mute
- Subscribe to RSS Feed
- Permalink
- Report Inappropriate Content
Hi,
Thanks for the reply.
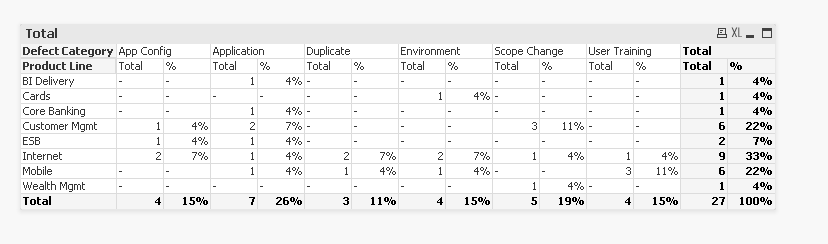
Please attach the Qvw file and can i add separate row for percentage at the bottom in the table option of the chart properties .You are showing it as a row i just want is the total % only to be shown at the row of each product line.For eg.15% should come at the bottom of 4.
App Config, Application etc etc ...
Total 4 , 7
% 15% , 26%
- Mark as New
- Bookmark
- Subscribe
- Mute
- Subscribe to RSS Feed
- Permalink
- Report Inappropriate Content
Hi,
did you look at my solution status1.3.qvw
Regards
ASHFAQ
- Mark as New
- Bookmark
- Subscribe
- Mute
- Subscribe to RSS Feed
- Permalink
- Report Inappropriate Content
HI nishika
PFA qvw.