Unlock a world of possibilities! Login now and discover the exclusive benefits awaiting you.
- Qlik Community
- :
- All Forums
- :
- QlikView App Dev
- :
- Line Chart by Distinct Date
- Subscribe to RSS Feed
- Mark Topic as New
- Mark Topic as Read
- Float this Topic for Current User
- Bookmark
- Subscribe
- Mute
- Printer Friendly Page
- Mark as New
- Bookmark
- Subscribe
- Mute
- Subscribe to RSS Feed
- Permalink
- Report Inappropriate Content
Line Chart by Distinct Date
I am looking to create a line chart by date.
The date field 'dat Start' is currently DD:MM:YYYY:SS and in the load script I used date(datStart,'DD-MM-YYYY') as DateX,
to create a new date field. This works fine. So I then used this as my Dimension in a line graph and this does not give me the unique date ..... the date just gets repeated by the timestamp I assume.
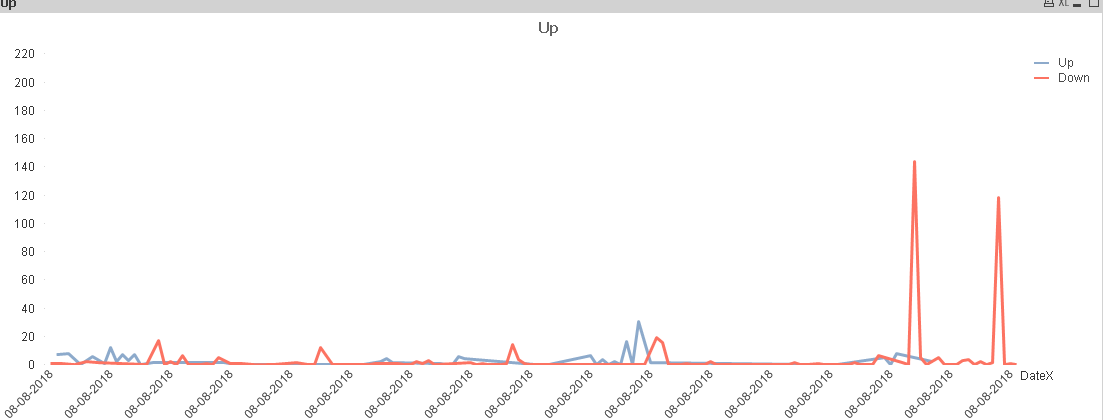
I wanted Date 8/8/2018 - 9/8/2018 - 10/8/2018 by expression sum (Up) and sum(Down)
But I get the 8th repeated across the X axis
Can someone please suggest what I can do to achieve this ?
- Tags:
- qlikview_scripting
- Mark as New
- Bookmark
- Subscribe
- Mute
- Subscribe to RSS Feed
- Permalink
- Report Inappropriate Content
Try changing [date(datStart,'DD-MM-YYYY') as DateX] to [date(Floor(datStart),'DD-MM-YYYY') as DateX].
- Mark as New
- Bookmark
- Subscribe
- Mute
- Subscribe to RSS Feed
- Permalink
- Report Inappropriate Content
Thanks Gavin. Works great !
- Mark as New
- Bookmark
- Subscribe
- Mute
- Subscribe to RSS Feed
- Permalink
- Report Inappropriate Content
Date() Is a formatting function that keeps your underlying distinct timestamp values.
You could use DayName(datStart) instead.
hope this helps
regards
Marco