Unlock a world of possibilities! Login now and discover the exclusive benefits awaiting you.
- Qlik Community
- :
- All Forums
- :
- QlikView App Dev
- :
- Script Dynamic Sub Totals
- Subscribe to RSS Feed
- Mark Topic as New
- Mark Topic as Read
- Float this Topic for Current User
- Bookmark
- Subscribe
- Mute
- Printer Friendly Page
- Mark as New
- Bookmark
- Subscribe
- Mute
- Subscribe to RSS Feed
- Permalink
- Report Inappropriate Content
Script Dynamic Sub Totals
Hello --
I am working on a dashboard that will help us plan for our data and backup storage requirements for the IT group. They want to be able to forecast how much backup storage will be required specifically based on the data retention they enter.
I am having trouble getting this to work correctly and I feel what I need is a way within Qlik script to be able to sub-total the last X rows based on a variable field.
I have a data table that provides some information about the systems being backed up. It contains the amount of storage they presently have, their rate of growth per day, and some other information regarding data compression and deduplication for backup.
| Node | Base Disk Size GB | Change Rate % | Backup Start | Compression Ratio | Daily Retention |
|---|---|---|---|---|---|
| A | 350 | 10% | 4/1/2017 | 50% | 5 |
| B | 100 | 9% | 4/1/2017 | 48% | 2 |
From this information I can start to make some calculations.
First, I create a table filling in a growth expectation for the data based on 10% change looking 365 days into the future.
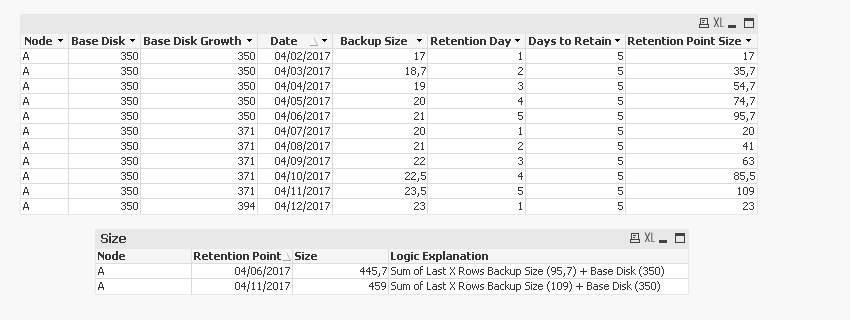
For each of those days, I have created a backup counter that creates an incremental backup of the base disk with growth and apply compression. I end up with a table that looks something like this. (I made up the numbers for the example)
| Node | Base Disk | Base Disk Growth | Date | Backup Size | Retention Day | Days to Retain |
|---|---|---|---|---|---|---|
| A | 350 | 350 | 4/2/2017 | 17 | 1 | 5 |
| A | 350 | 350 | 4/3/2017 | 18.7 | 2 | 5 |
| A | 350 | 350 | 4/4/2017 | 19 | 3 | 5 |
| A | 350 | 350 | 4/5/2017 | 20 | 4 | 5 |
| A | 350 | 350 | 4/6/2017 | 21 | 5 | 5 |
| A | 350 | 371 | 4/7/2017 | 20 | 1 | 5 |
| A | 350 | 371 | 4/8/2017 | 21 | 2 | 5 |
| A | 350 | 371 | 4/9/2017 | 22 | 3 | 5 |
| A | 350 | 371 | 4/10/2017 | 22.5 | 4 | 5 |
| A | 350 | 371 | 4/11/2017 | 23.5 | 5 | 5 |
| A | 350 | 394 | 4/12/2017 | 23 | 1 | 5 |
As you can see in the example, the backup size will growth as the base disk grows over time - however they only want to subtotal the amount of data that would be retained per their policy
So in the instance, I would like to subtotal in script the last X rows (using the Daily Retention)
Ultimately, I'd like to end up with a table that looks something like this
| Node | Retention Point | Size | Logic Explanation |
|---|---|---|---|
| A | 4/6/2017 | 445 | Sum of Last X Rows Backup Size (95.7) + Base Disk (350) |
| A | 4/11/2017 | 449 | Sum of Last X Rows Backup Size (109) + Base Disk (350) |
I know I could do this using the Peek() function, but the problem I am having is that the days to retain is going to be different per node. How can I go back X number of rows to get this rolling total within the script dynamically?
Thanks!
- Mark as New
- Bookmark
- Subscribe
- Mute
- Subscribe to RSS Feed
- Permalink
- Report Inappropriate Content
Hi Joe,
I think we could solve your proeblem with the following code:
BACKUP:
LOAD Node,
[Base Disk],
[Base Disk Growth],
Date,
[Backup Size],
[Retention Day],
[Days to Retain],
[Backup Size] +
If([Retention Day] = 1,
0,
Peek('Retention Point Size', -1, 'BACKUP')) AS [Retention Point Size]
FROM BACKUP.xlsx (ooxml, embedded labels, table is Hoja1);
NOTE: there is a strong precondition in the above code all the data in BAKUP table MUST be previously ordered by Node ASC, and Date ASC. If is not ordered so, the peek function will show an unpredictable result.
What we do in [Retention Point Size] field generation is:
- Always sum the [Backup Size] field value.
- Look at the current record value in field [Retention Day].
- If is the first day of the sequence to retain I donot sum anything as I donot want to accumulate value.
- Else, I take the value of the precedent record in the [Retention Point SIze] field as it contains the accumulated value.
Does not matter if nodes have different days to retain even if a node change its; only matter that the origin table is ordered by node and date.
The result could be:
I attach you a sample. Hope it serves!
Regards,
H
- Mark as New
- Bookmark
- Subscribe
- Mute
- Subscribe to RSS Feed
- Permalink
- Report Inappropriate Content
I attach the excel file here...