Unlock a world of possibilities! Login now and discover the exclusive benefits awaiting you.
- Qlik Community
- :
- All Forums
- :
- QlikView App Dev
- :
- Re: Transforming an Excel table
- Subscribe to RSS Feed
- Mark Topic as New
- Mark Topic as Read
- Float this Topic for Current User
- Bookmark
- Subscribe
- Mute
- Printer Friendly Page
- Mark as New
- Bookmark
- Subscribe
- Mute
- Subscribe to RSS Feed
- Permalink
- Report Inappropriate Content
Transforming an Excel table
I have the next Excel tabel and i want to transform it into another format.
Source;
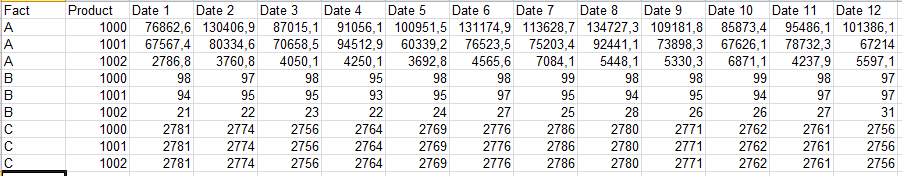
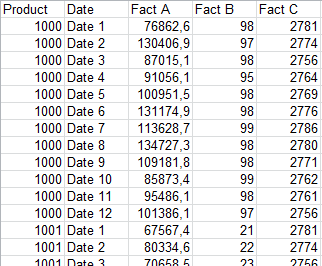
The table in QV should look like this.
Can anyone help me out here, I 've tried (see the attached QV file) but I didn't get to the right result.
Thnx in advance!!
Accepted Solutions
- Mark as New
- Bookmark
- Subscribe
- Mute
- Subscribe to RSS Feed
- Permalink
- Report Inappropriate Content
add this code to the load script:
finalTable2:
load
'new' as dummy,
fProduct,
fDate,
sum(FactA) as FactA,
sum(FactB) as FactB,
sum(FactC) as FactC
resident finalTable
group by fProduct,
fDate;
drop table finalTable;
drop field dummy;
- Mark as New
- Bookmark
- Subscribe
- Mute
- Subscribe to RSS Feed
- Permalink
- Report Inappropriate Content
hi,
not sure if you just wantthe result in a chart or if you are looking for an actaul table with three Facts A, B and C.
The attached qvw shows how to achieve both.
the chart solution can be built straight out of what you already have.
The table solution requires some more code in the script.
- Mark as New
- Bookmark
- Subscribe
- Mute
- Subscribe to RSS Feed
- Permalink
- Report Inappropriate Content
I'm looking for a actual table with the three facts, the example you sent me is almost the solution;
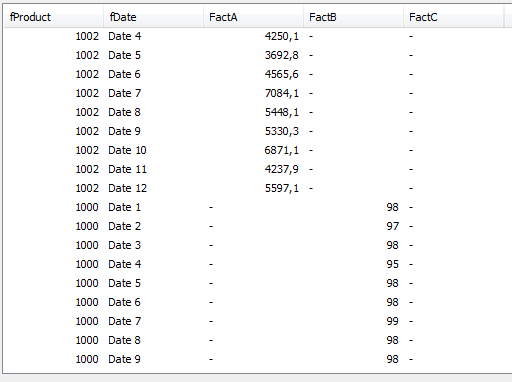
But I want the facts on one row so I can perform calculations on row level and not only on aggregated level.

- Mark as New
- Bookmark
- Subscribe
- Mute
- Subscribe to RSS Feed
- Permalink
- Report Inappropriate Content
add this code to the load script:
finalTable2:
load
'new' as dummy,
fProduct,
fDate,
sum(FactA) as FactA,
sum(FactB) as FactB,
sum(FactC) as FactC
resident finalTable
group by fProduct,
fDate;
drop table finalTable;
drop field dummy;
- Mark as New
- Bookmark
- Subscribe
- Mute
- Subscribe to RSS Feed
- Permalink
- Report Inappropriate Content
That's it!! Thnx!!