Unlock a world of possibilities! Login now and discover the exclusive benefits awaiting you.
- Qlik Community
- :
- All Forums
- :
- QlikView App Dev
- :
- Re: Unchange the expression data when I select fie...
- Subscribe to RSS Feed
- Mark Topic as New
- Mark Topic as Read
- Float this Topic for Current User
- Bookmark
- Subscribe
- Mute
- Printer Friendly Page
- Mark as New
- Bookmark
- Subscribe
- Mute
- Subscribe to RSS Feed
- Permalink
- Report Inappropriate Content
Unchange the expression data when I select field on another table
Hello,
I have two charts on one sheet,
if I selection one of Project Manager, and without change the Percentage on the other table (Staffing Projection Table).
How I express this ?
thanks for your help.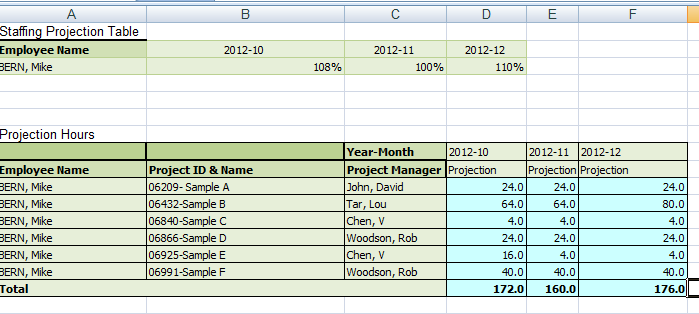
One More requiremnt:
Hello,
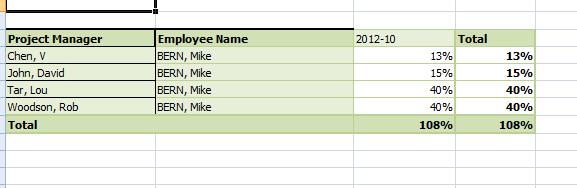
I try to select one of Project Manager (CHEN, V) , I want to show the total 108 % for this employee, not just 13%.
Is it possible ?
Thanks,
H
- Tags:
- qlikview_scripting
- Mark as New
- Bookmark
- Subscribe
- Mute
- Subscribe to RSS Feed
- Permalink
- Report Inappropriate Content
If you don't want the above chart to respond to selection in Project Manager field, use set analysis in the above chart's expr.
Post ur charts' expr here, so that i can modify it and repost.
regards
- Mark as New
- Bookmark
- Subscribe
- Mute
- Subscribe to RSS Feed
- Permalink
- Report Inappropriate Content
Hi
I think you want to exclude the selection in that particular chart? am i correct? if so,
use any of the following
1.Alternate state for that chart.
2.Detached that chart
3.Sum({1}Sales) in expression
These option exclude the selections
Hope that helps
Please close the thread by marking correct answer & give likes if you like the post.
- Mark as New
- Bookmark
- Subscribe
- Mute
- Subscribe to RSS Feed
- Permalink
- Report Inappropriate Content
Hello,
I try to select one of Project Manager (CHEN, V) , I want to show the total 108 % for this employee, not just 13%.
Is it possible ?
Thanks,
H

- Mark as New
- Bookmark
- Subscribe
- Mute
- Subscribe to RSS Feed
- Permalink
- Report Inappropriate Content
HI
Try like this
If you use sum(total Amount) always gives the total amount of all..
=sum(total<ProjectManager> Amount) gives based on project manager amount
=Sum(total<EmployeeName>Amount) gives based on employeename amount,
Hope that helps
Please close the thread by marking correct answer & give likes if you like the post.
- Mark as New
- Bookmark
- Subscribe
- Mute
- Subscribe to RSS Feed
- Permalink
- Report Inappropriate Content
Hello,
I use your suggestion
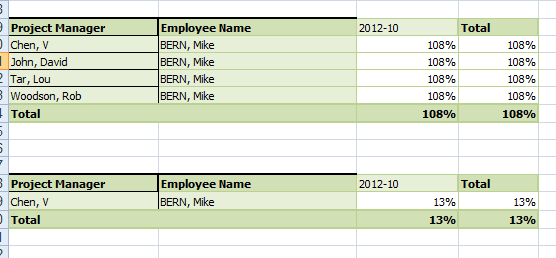
=Sum(total<EmployeeName>Amount) gives based on employeename amount,
Then, I got 108% for each Project Manger. But I pick (CHEN, V) PM then I still got 13%.
Thanks,
Henness
- Mark as New
- Bookmark
- Subscribe
- Mute
- Subscribe to RSS Feed
- Permalink
- Report Inappropriate Content
Can you upload a sample file?
- Mark as New
- Bookmark
- Subscribe
- Mute
- Subscribe to RSS Feed
- Permalink
- Report Inappropriate Content
Hi
I think its give some idea to you,
=if(GetFieldSelections(ProjectManager) > 1,Sum({1}TOTAL Amount), Sum(total<EmployeeName>Amount))
Please close the thread by marking correct answer & give likes if you like the post.