Unlock a world of possibilities! Login now and discover the exclusive benefits awaiting you.

- Qlik Community
- :
- All Forums
- :
- QlikView
- :
- Re: 100% Stacked Bar Graph
- Subscribe to RSS Feed
- Mark Topic as New
- Mark Topic as Read
- Float this Topic for Current User
- Bookmark
- Subscribe
- Mute
- Printer Friendly Page

- Mark as New
- Bookmark
- Subscribe
- Mute
- Subscribe to RSS Feed
- Permalink
- Report Inappropriate Content
100% Stacked Bar Graph
Hello All
I have to build an Stacked Bar Graph where all bars sum 100%.
One dimention its, for instance, "months" and the other one is "Clients" and the expresion its a count of an specific item.
So, what i have to show its how participate each client on the total count for each month.
Let me ilustrate with an example table:
MONTH
CLIENT 1 2 3 4 TOTAL
X1 100 300 200 100 700
X2 350 300 100 150 900
X3 200 100 100 150 550
If i make an stacked bar graph abput this table, you will not see 100% bars. Will see 3 bars of diferents sizes based on Sum of quantities.
What i need are 3 100% bars based on participation.
Any help please????
Thanks for All
- « Previous Replies
-
- 1
- 2
- Next Replies »

 suryaa30
- Mark as New
- Bookmark
- Subscribe
- Mute
- Subscribe to RSS Feed
- Permalink
- Report Inappropriate Content
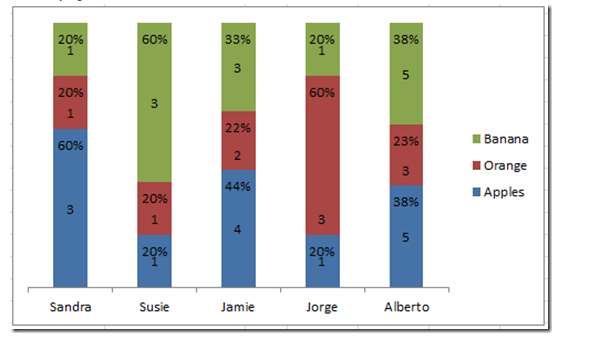
Is there a way to retain the count as it is instead of percentage? but still all bars being equal!! sounds weird but I have this requirement.
I have created a stacked 100 % chart and now all bars are equal but the customer wants to show the original count
For stacked assume I am using Sum(Field)/Sum(TOTAL Field)

 kai_kathy_shen
- Mark as New
- Bookmark
- Subscribe
- Mute
- Subscribe to RSS Feed
- Permalink
- Report Inappropriate Content
What if there are more alternate dimensions in the chart.
Then the field I put in the TOTAL<...> should be the horizontal dimension, but I wouldn't be able to tell which one user has toggled. How should I write the expression to cater for alternate dimensions?

- « Previous Replies
-
- 1
- 2
- Next Replies »