Unlock a world of possibilities! Login now and discover the exclusive benefits awaiting you.

- Qlik Community
- :
- All Forums
- :
- QlikView
- :
- Re: 100% Stacked Line graph
- Subscribe to RSS Feed
- Mark Topic as New
- Mark Topic as Read
- Float this Topic for Current User
- Bookmark
- Subscribe
- Mute
- Printer Friendly Page

- Mark as New
- Bookmark
- Subscribe
- Mute
- Subscribe to RSS Feed
- Permalink
- Report Inappropriate Content
100% Stacked Line graph
Hello,
I wanna create a 100% stacked line graph like in this : How to create a "100 % Stacked Column Excel Chart" in QV
But I dont know how to do it with my expression.
I have these 3 expressions:
=count({<GroupingBuyers={'One'}>} DISTINCT CookieIDINT)
=count({<GroupingBuyers={'Two'}>} DISTINCT CookieIDINT)
=count({<GroupingBuyers={'Repeat'}>} DISTINCT CookieIDINT)
Dimension is Week (Could maybe also be GroupingBuyers?)
Accepted Solutions
- Mark as New
- Bookmark
- Subscribe
- Mute
- Subscribe to RSS Feed
- Permalink
- Report Inappropriate Content
I figured out how to do it.
Sliced it on the dimensions, removed my filter in the expression and added a total. So my expression looks like this now:
=count(DISTINCT CookieIDINT) / count(Total <Month> DISTINCT CookieIDINT)
Added groupingbuyers as dimension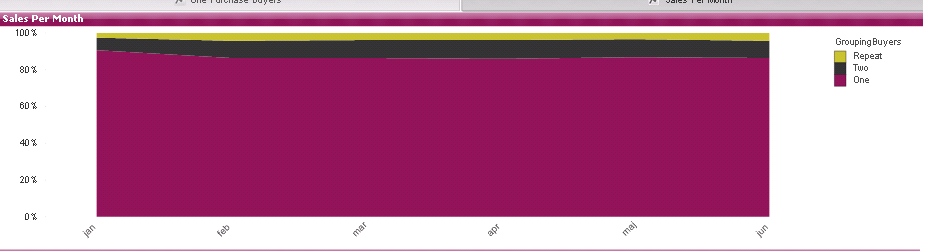

 MK_QSL
- Mark as New
- Bookmark
- Subscribe
- Mute
- Subscribe to RSS Feed
- Permalink
- Report Inappropriate Content
Can you provide sample file pls?
I don't think so Stacked Line Chart is possible !
- Mark as New
- Bookmark
- Subscribe
- Mute
- Subscribe to RSS Feed
- Permalink
- Report Inappropriate Content
I figured out how to do it.
Sliced it on the dimensions, removed my filter in the expression and added a total. So my expression looks like this now:
=count(DISTINCT CookieIDINT) / count(Total <Month> DISTINCT CookieIDINT)
Added groupingbuyers as dimension
- Mark as New
- Bookmark
- Subscribe
- Mute
- Subscribe to RSS Feed
- Permalink
- Report Inappropriate Content
Hi Thomas! Can you attach a file with your solution?
Thanks,
Joakim