Unlock a world of possibilities! Login now and discover the exclusive benefits awaiting you.

- Qlik Community
- :
- All Forums
- :
- QlikView
- :
- A simple question?
- Subscribe to RSS Feed
- Mark Topic as New
- Mark Topic as Read
- Float this Topic for Current User
- Bookmark
- Subscribe
- Mute
- Printer Friendly Page

- Mark as New
- Bookmark
- Subscribe
- Mute
- Subscribe to RSS Feed
- Permalink
- Report Inappropriate Content
A simple question?
Hi all 
Consider this table:
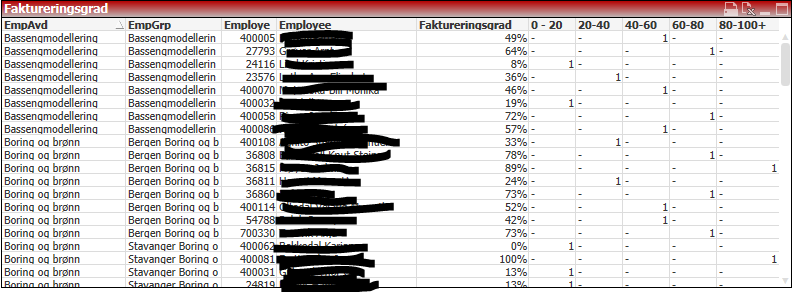
The expression behind the 0-20 -> 80-100 colums looks like this:
if
(sum({$<EmpAvd=>}if(mixmatch([Activity No.],1000,1099)> 0 and mixmatch([Activity Type], 'Time') > 0,[Registered Quantity])) /
sum({$<EmpAvd=>}if(mixmatch([Activity No.],1000,1099,1100,1200,9000,9010,9011,9100,9600)> 0 and mixmatch([Activity Type], 'Time') > 0,[Registered Quantity]))
>=.2
AND
sum({$<EmpAvd=>}if(mixmatch([Activity No.],1000,1099)> 0 and mixmatch([Activity Type], 'Time') > 0,[Registered Quantity])) /
sum({$<EmpAvd=>}if(mixmatch([Activity No.],1000,1099,1100,1200,9000,9010,9011,9100,9600)> 0 and mixmatch([Activity Type], 'Time') > 0,[Registered Quantity]))
<.4, count(DISTINCT [Employee No.]))
My challange is that I need to present this as a bar chart, presenting the sum of all counts in the 0-20, 20-40, 40-60, 60-80, 80-100 colums.
What is the easiest way to accomplish that?
Best regards
Trond E