Unlock a world of possibilities! Login now and discover the exclusive benefits awaiting you.
- Qlik Community
- :
- All Forums
- :
- QlikView
- :
- AGGR and set analysis quandry
- Subscribe to RSS Feed
- Mark Topic as New
- Mark Topic as Read
- Float this Topic for Current User
- Bookmark
- Subscribe
- Mute
- Printer Friendly Page
- Mark as New
- Bookmark
- Subscribe
- Mute
- Subscribe to RSS Feed
- Permalink
- Report Inappropriate Content
AGGR and set analysis quandry
Hi All,
The attached qvw will explain the issue better than I can in words. Note my production qvw is a lot more complex, however this explains the crux of the issue
Basically I am tying to create an index value based on a number of columns, I can do this absolutely fine in a chart for the selected dimension.
The formula is:
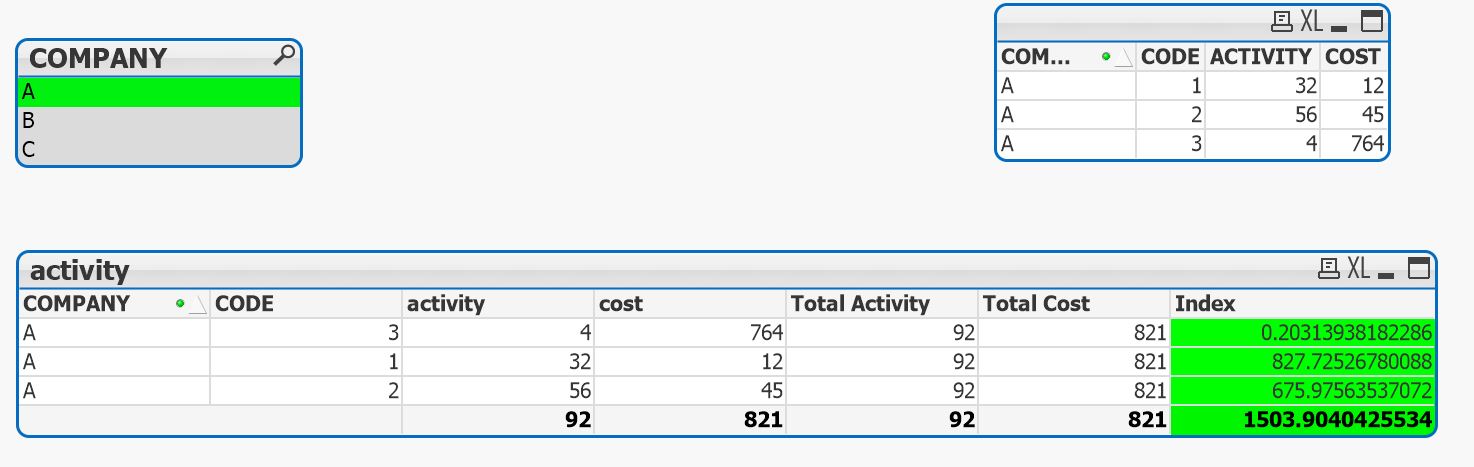
((((SUM(ACTIVITY) / SUM(COST))/(SUM(TOTAL ACTIVITY) / SUM(TOTAL COST)))* SUM(ACTIVITY))/(SUM(TOTAL ACTIVITY) ))*100
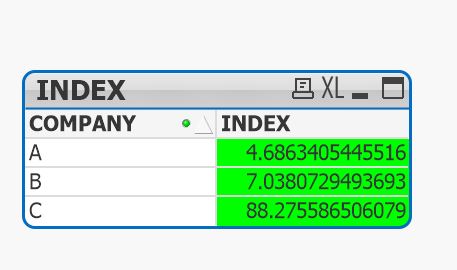
What I then want to do, is show the same value in a chart for ALL dimensions, even though one of those dimensions is selected
However the index value is the sum of a calculation done at a line level so for company A index = 1503.90
This is what I want to end up with, but with the right values:
My current formula is:
sum( {<COMPANY-= >}
aggr(
SUM({<COMPANY-= >}
AGGR(
(
(
( /*weight*/
(sum({<COMPANY-= >}COST)
/ sum({<COMPANY-= >}ACTIVITY)
)
/
(sum(TOTAL {<COMPANY-= >}COST)
/ sum(TOTAL {<COMPANY-= >}ACTIVITY)
)
)
*
( /*activity*/
sum({<COMPANY-=>}ACTIVITY)
)
)
/
/*total activity*/
sum(TOTAL {<COMPANY-= >}ACTIVITY)
) *100
,CODE,COMPANY)
),COMPANY
)
)
Now I am 99% sure this is going wrong due to the TOTALs, because it is using the totals for ALL dimensions, not PER dimension
But I am going in circles trying to figure it out!
- Tags:
- aggr
- set_analysis
Accepted Solutions
- Mark as New
- Bookmark
- Subscribe
- Mute
- Subscribe to RSS Feed
- Permalink
- Report Inappropriate Content
I think this might be the reformulated expression that could calculate what you want - I attached the modified QVW too:

- Mark as New
- Bookmark
- Subscribe
- Mute
- Subscribe to RSS Feed
- Permalink
- Report Inappropriate Content
Not sure I understand the expected out? What exactly are you trying to get?
- Mark as New
- Bookmark
- Subscribe
- Mute
- Subscribe to RSS Feed
- Permalink
- Report Inappropriate Content
I think this might be the reformulated expression that could calculate what you want - I attached the modified QVW too:
- Mark as New
- Bookmark
- Subscribe
- Mute
- Subscribe to RSS Feed
- Permalink
- Report Inappropriate Content
That looks good thank you, can you explain the syntax to me as I haven't come across the use of angle brackets like that before.
I'll put it in my production dashboard tomorrow and check it scales up with the complexity!
- Mark as New
- Bookmark
- Subscribe
- Mute
- Subscribe to RSS Feed
- Permalink
- Report Inappropriate Content
actually no it does make sense now I read the syntax for total, thank you!