Unlock a world of possibilities! Login now and discover the exclusive benefits awaiting you.

- Qlik Community
- :
- All Forums
- :
- QlikView
- :
- Re: Accumulation Chart
- Subscribe to RSS Feed
- Mark Topic as New
- Mark Topic as Read
- Float this Topic for Current User
- Bookmark
- Subscribe
- Mute
- Printer Friendly Page

- Mark as New
- Bookmark
- Subscribe
- Mute
- Subscribe to RSS Feed
- Permalink
- Report Inappropriate Content
Accumulation Chart
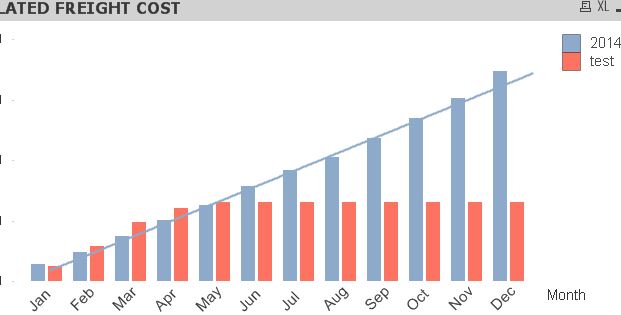
I am attempting to do an accumulation chart of our Freight Costs YTD and LYTD. The LYTD is working great... but with the YTD I only want to see the chart up to the Previous Month.
Currently - it is adding "0" freight costs so my chart flat lines. This is causing my trend line to be inaccurate based on YTD trends.
Accepted Solutions

 sunny_talwar
- Mark as New
- Bookmark
- Subscribe
- Mute
- Subscribe to RSS Feed
- Permalink
- Report Inappropriate Content
Try this without full accumulation:
=If(Sum({<Year= {'2015'}>}FreightCost) <> 0, RangeSum(Above(Sum({<Year= {'2015'}>}FreightCost), 0, RowNo(TOTAL))))
sunny_talwar
- Mark as New
- Bookmark
- Subscribe
- Mute
- Subscribe to RSS Feed
- Permalink
- Report Inappropriate Content
I am assuming you are using two expressions. For the expression which is adding bars for future month, you can do something like this:
If(Sum(Value) <> 0, thenAccumulateExpression)
- Mark as New
- Bookmark
- Subscribe
- Mute
- Subscribe to RSS Feed
- Permalink
- Report Inappropriate Content
I have added that to my my formula. But still getting the same results.
This is the formula I am using - Sum({<Year= {'2015'}>}FreightCost)
And then I select full accumulation at the bottom.
I think my formula needs to do the accumulation instead of the hot key in the chart properties. But I don't know how to write it.
sunny_talwar
- Mark as New
- Bookmark
- Subscribe
- Mute
- Subscribe to RSS Feed
- Permalink
- Report Inappropriate Content
Try this without full accumulation:
=If(Sum({<Year= {'2015'}>}FreightCost) <> 0, RangeSum(Above(Sum({<Year= {'2015'}>}FreightCost), 0, RowNo(TOTAL))))
- Mark as New
- Bookmark
- Subscribe
- Mute
- Subscribe to RSS Feed
- Permalink
- Report Inappropriate Content
YOU ARE MY HERO!
sunny_talwar
- Mark as New
- Bookmark
- Subscribe
- Mute
- Subscribe to RSS Feed
- Permalink
- Report Inappropriate Content
Hahahaha, I am glad it worked 
Sunny