Unlock a world of possibilities! Login now and discover the exclusive benefits awaiting you.

- Qlik Community
- :
- All Forums
- :
- QlikView
- :
- Aggr & Set Expression Problem
- Subscribe to RSS Feed
- Mark Topic as New
- Mark Topic as Read
- Float this Topic for Current User
- Bookmark
- Subscribe
- Mute
- Printer Friendly Page

 robinrouleur
- Mark as New
- Bookmark
- Subscribe
- Mute
- Subscribe to RSS Feed
- Permalink
- Report Inappropriate Content
Aggr & Set Expression Problem
Hi
I've been struggling with this for a while so I'm hoping someone can help?
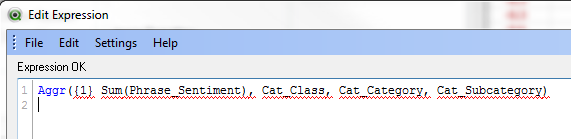
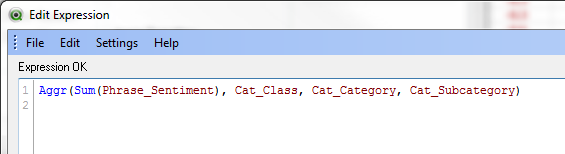
I have a simple table dataset with multiple rows for each ID. I want to produce a table chart with the rows for each ID aggregated into one based on a simple expression. I can do this with Aggr but when I try to add a Set Expression to, for example, execute over the whole data set rather than the current selection, it doesn't work. The chart expression is "OK" but I get a red underline which suggests something is wrong. Here's a couple of screenshots, with and without the set expression. Am I missing something? Is this the correct/best way to achieve my objective? Phrase_Sentiment is numeric, the three "Cat_" are string dimensions (single field, not calculated).

 chiru_thota
- Mark as New
- Bookmark
- Subscribe
- Mute
- Subscribe to RSS Feed
- Permalink
- Report Inappropriate Content
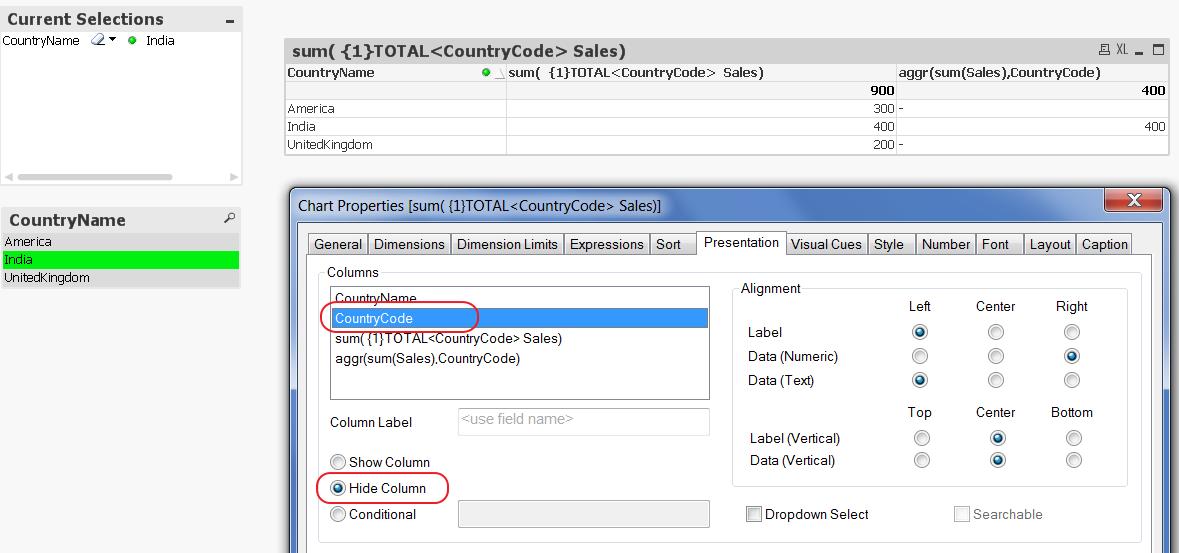
Can you see to use below expression for your requirement ?
Note : you can add dimensions which ever you don't need to the report and hide them.So that Total will work fine.
robinrouleur
- Mark as New
- Bookmark
- Subscribe
- Mute
- Subscribe to RSS Feed
- Permalink
- Report Inappropriate Content
Thanks, it's not what I wanted but it started me thinking and I realised that my brain mustn't have been working last night, I don't need the Aggr function at all !! Problem solved.

 mahesh_agrawal
- Mark as New
- Bookmark
- Subscribe
- Mute
- Subscribe to RSS Feed
- Permalink
- Report Inappropriate Content
Hi,
Try this one.
aggr(sum({1}Phrase_sentiment),Cat_Class,Cat_Category,Cat_SubCategory)

 er_mohit
- Mark as New
- Bookmark
- Subscribe
- Mute
- Subscribe to RSS Feed
- Permalink
- Report Inappropriate Content
write
sum({1} phrase_sentiment)
