Unlock a world of possibilities! Login now and discover the exclusive benefits awaiting you.
- Qlik Community
- :
- All Forums
- :
- QlikView
- :
- Bar Chart Displayed as Percentage from Counted Ite...
- Subscribe to RSS Feed
- Mark Topic as New
- Mark Topic as Read
- Float this Topic for Current User
- Bookmark
- Subscribe
- Mute
- Printer Friendly Page
- Mark as New
- Bookmark
- Subscribe
- Mute
- Subscribe to RSS Feed
- Permalink
- Report Inappropriate Content
Bar Chart Displayed as Percentage from Counted Items
Hello everyone,
This is the first time I've posted to the community and I'm a very new Qlik Sense user. I'm trying to create a bar chart that shows data as a percentage. I have two fields that I'm trying to use in this example: Position and Score. Position has four possible values: A, C, T, G. Score has four possible values: 2, 1, 0, N/A. I'm trying to create four charts (or one if I can fit all the following in) that show the percentage of the total count of Position by Score. % Position is my Y-axis and Score is my X-axis.
Example: I want to calculate the percentage for Position equals A across the different Scores of 2, 1, and 0 (I want to ignore N/A's). Once I figure this out, I'm going to create similar charts for Position equals C, T and G. Or if you know how to do all of this in one chart, please let me know.
I've been able to create a bar chart that shows the count of the Position equal to A as my Y-axis with 2, 1, 0, N/A as my X-axis, but I can't go from a count to a percentage. When I tried creating the percentage I just ended up with values of 1 across the different Scores. I can easily keep the N/A's out by adding a filter to my app, but I would rather keep them out all together.
Any help would be appreciated.
Regards,
Todd
- Mark as New
- Bookmark
- Subscribe
- Mute
- Subscribe to RSS Feed
- Permalink
- Report Inappropriate Content
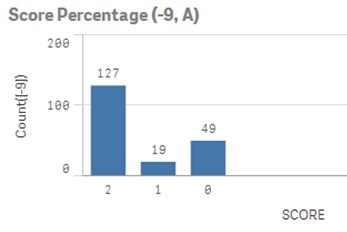
I discovered how to load the data without bringing in records that contained N/A for the Score so I don't need to worry about that aspect. I'm still trying to figure out how to change the count of records to a percentage. Below is the chart I'm able to make. I want the Count([-9]) field to be a percentage and not a total.