Unlock a world of possibilities! Login now and discover the exclusive benefits awaiting you.

Announcements
Share your agentic AI experience, learn from others, and earn a new badge: Put Agentic AI to Work
- Qlik Community
- :
- All Forums
- :
- QlikView
- :
- Re: Bar Graph Not Showing months continuously
Options
- Subscribe to RSS Feed
- Mark Topic as New
- Mark Topic as Read
- Float this Topic for Current User
- Bookmark
- Subscribe
- Mute
- Printer Friendly Page
Turn on suggestions
Auto-suggest helps you quickly narrow down your search results by suggesting possible matches as you type.
Showing results for

 MikeHerb
Contributor III
2021-03-03
02:01 AM
- Mark as New
- Bookmark
- Subscribe
- Mute
- Subscribe to RSS Feed
- Permalink
- Report Inappropriate Content
Bar Graph Not Showing months continuously
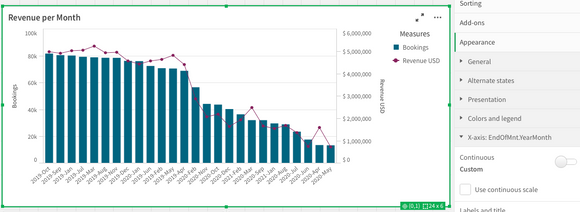
I have this graph when I do not sort the X axis as continous the whole month is filled:
As soon as I click on the continuous scale which I want it to be the bars get thinner:
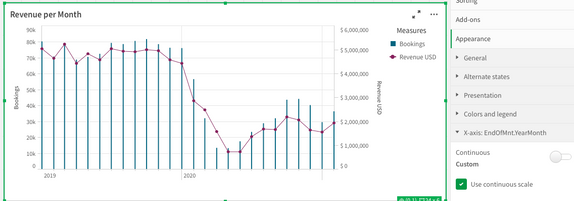
How do I get the thick per month bars with data being sorted by year-month?
729 Views
1 Solution
Accepted Solutions
MikeHerb
Contributor III
2021-03-03
04:31 AM
Author
- Mark as New
- Bookmark
- Subscribe
- Mute
- Subscribe to RSS Feed
- Permalink
- Report Inappropriate Content
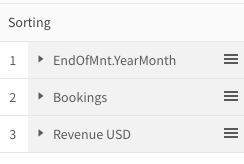
solved! I didn't place the sorting menu correctly at first, now it is!!
695 Views
1 Reply
MikeHerb
Contributor III
2021-03-03
04:31 AM
Author
- Mark as New
- Bookmark
- Subscribe
- Mute
- Subscribe to RSS Feed
- Permalink
- Report Inappropriate Content
solved! I didn't place the sorting menu correctly at first, now it is!!
696 Views
