Unlock a world of possibilities! Login now and discover the exclusive benefits awaiting you.

- Qlik Community
- :
- All Forums
- :
- QlikView
- :
- Re: Bar and Line Series in same Chart
- Subscribe to RSS Feed
- Mark Topic as New
- Mark Topic as Read
- Float this Topic for Current User
- Bookmark
- Subscribe
- Mute
- Printer Friendly Page

- Mark as New
- Bookmark
- Subscribe
- Mute
- Subscribe to RSS Feed
- Permalink
- Report Inappropriate Content
Bar and Line Series in same Chart
Hi
In top chart I am trying to show the 2010/11 value as Bar chart and the rest as line chart.
I manage to achive this using the set operators (Avg ({$<FinYear = {[2010/11]}>}LoSLoS)) but lost of ability to filter on Finincial year.
I can quite easly acgive this in excel by changing the chart series. However, I was wondering if there is an easy way to do the same in Qlikview
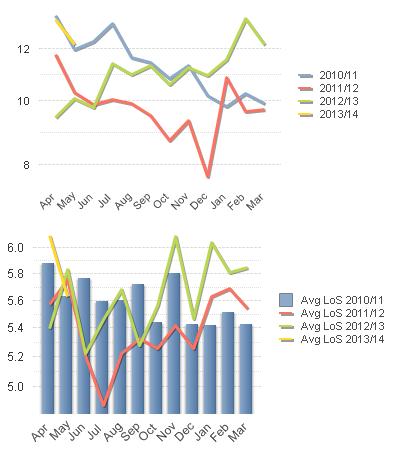
Any help in this regard will be much appricaited.
Accepted Solutions

 swuehl
- Mark as New
- Bookmark
- Subscribe
- Mute
- Subscribe to RSS Feed
- Permalink
- Report Inappropriate Content
I manage to achive this using the set operators (Avg ({$<FinYear = {[2010/11]}>}LoSLoS)) but lost of ability to filter on Finincial year.
So you are using several expressions instead of one expression and a second FinYear dimension, right?
You can use the intersection set operator to keep your FinYear sensitive to selections:
Avg ({$<FinYear *= {[2010/11]}>}LoSLoS)
swuehl
- Mark as New
- Bookmark
- Subscribe
- Mute
- Subscribe to RSS Feed
- Permalink
- Report Inappropriate Content
I manage to achive this using the set operators (Avg ({$<FinYear = {[2010/11]}>}LoSLoS)) but lost of ability to filter on Finincial year.
So you are using several expressions instead of one expression and a second FinYear dimension, right?
You can use the intersection set operator to keep your FinYear sensitive to selections:
Avg ({$<FinYear *= {[2010/11]}>}LoSLoS)
- Mark as New
- Bookmark
- Subscribe
- Mute
- Subscribe to RSS Feed
- Permalink
- Report Inappropriate Content
Yes, i was using several expressions. One expression for each finincial year
Thank you so much, intersection set operator has solved the problem