Unlock a world of possibilities! Login now and discover the exclusive benefits awaiting you.

- Qlik Community
- :
- All Forums
- :
- QlikView
- :
- Re: Bar chart
- Subscribe to RSS Feed
- Mark Topic as New
- Mark Topic as Read
- Float this Topic for Current User
- Bookmark
- Subscribe
- Mute
- Printer Friendly Page

 bharatkishore
- Mark as New
- Bookmark
- Subscribe
- Mute
- Subscribe to RSS Feed
- Permalink
- Report Inappropriate Content
Bar chart
Hi All,
I have a bar chart. And i have taken two dimensions i.e. MonthYear and Cat.
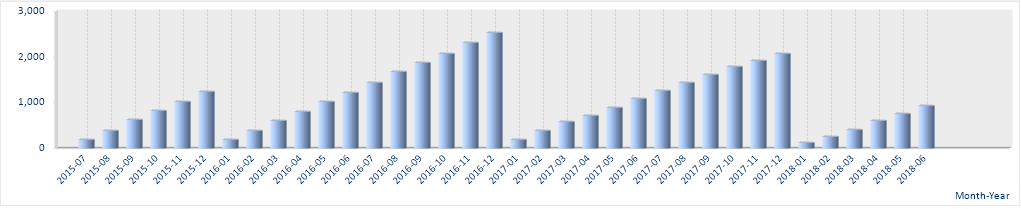
Now when i take one dimension i.e. MonthYear and write the below expression. It is working fine.
=RangeSum(Above(SUM({<MonthYear={">=$(=Date(AddMonths(Max(MonthYear), -36)))<=$(=Date(Max(MonthYear)))"}
>}(Consumption)),0, Month(Only({<MonthYear={">=$(=Date(AddMonths(Max(MonthYear), -36)))<=$(=Date(Max(MonthYear)))"}>}Month)))). Below image for reference:
Now when i add one more dimension i.e. Cat the values are getting changed. Below image for reference:
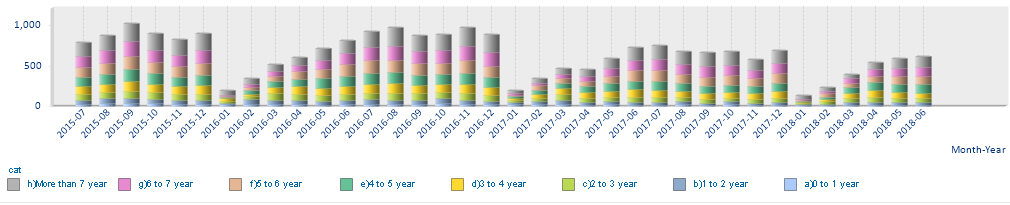
Can you please help me what can i do, even though if i add the dimension the values should not change.
Thanks,
Bharat
Accepted Solutions

 sunny_talwar
- Mark as New
- Bookmark
- Subscribe
- Mute
- Subscribe to RSS Feed
- Permalink
- Report Inappropriate Content
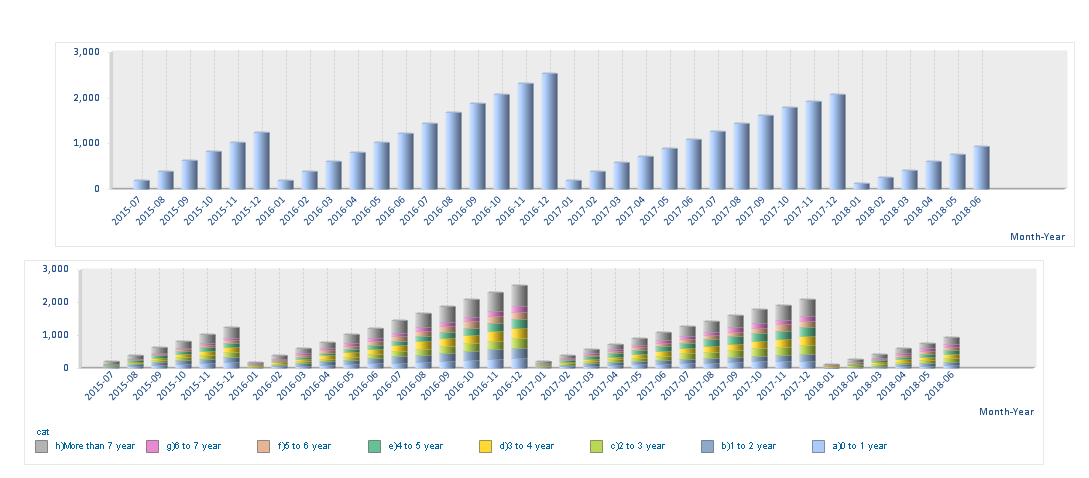
If you have QV12 or above... you can try this
Only({<MonthYear={">=$(=Date(AddMonths(Max(MonthYear), -36)))<=$(=Date(Max(MonthYear)))"}>} Aggr(
RangeSum(Above(Sum({<MonthYear={">=$(=Date(AddMonths(Max(MonthYear), -36)))<=$(=Date(Max(MonthYear)))"}
>} Consumption), 0, Month(Only({<MonthYear={">=$(=Date(AddMonths(Max(MonthYear), -36)))<=$(=Date(Max(MonthYear)))"}>} Month))))
, cat, (MonthYear, (NUMERIC))))
sunny_talwar
- Mark as New
- Bookmark
- Subscribe
- Mute
- Subscribe to RSS Feed
- Permalink
- Report Inappropriate Content
Try this
Only(({<MonthYear={">=$(=Date(AddMonths(Max(MonthYear), -36)))<=$(=Date(Max(MonthYear)))"}>} Aggr(
RangeSum(Above(Sum({<MonthYear={">=$(=Date(AddMonths(Max(MonthYear), -36)))<=$(=Date(Max(MonthYear)))"}
>} Consumption), 0, Month(Only({<MonthYear={">=$(=Date(AddMonths(Max(MonthYear), -36)))<=$(=Date(Max(MonthYear)))"}>} Month))))
, Cat, MonthYear))
bharatkishore
- Mark as New
- Bookmark
- Subscribe
- Mute
- Subscribe to RSS Feed
- Permalink
- Report Inappropriate Content
Sorry Sunny Bhai.. Not getting the right value. Below image for reference:

sunny_talwar
- Mark as New
- Bookmark
- Subscribe
- Mute
- Subscribe to RSS Feed
- Permalink
- Report Inappropriate Content
Are you able to share a sample?
bharatkishore
- Mark as New
- Bookmark
- Subscribe
- Mute
- Subscribe to RSS Feed
- Permalink
- Report Inappropriate Content
Please find the attach file Sunny Bhai.
If you filter for 2015 from July to 2015 Dec and cat as More than 7 year the correct value is 335 but with help of your expression it is 311.
Kindly check and let me know if you need anything more.
Thanks,
Bharat

 johanlindell
- Mark as New
- Bookmark
- Subscribe
- Mute
- Subscribe to RSS Feed
- Permalink
- Report Inappropriate Content
Hi,
Are you trying to make an aggregate for each year? If so create a "Year month" column in your fact table and a new dimension table with a "Year month" and a "Year month YTD aggr" columns looking like this.
"Year month", "Year month YTD aggr"
2015-01, 2015-01
2015-01, 2015-02
2015-02, 2015-02
2015-01, 2015-03
2015-02, 2015-03
2015-03, 2015-03
2015-01, 2015-04
2015-02, 2015-04
2015-03, 2015-04
2015-04, 2015-04
etc.
sunny_talwar
- Mark as New
- Bookmark
- Subscribe
- Mute
- Subscribe to RSS Feed
- Permalink
- Report Inappropriate Content
If you have QV12 or above... you can try this
Only({<MonthYear={">=$(=Date(AddMonths(Max(MonthYear), -36)))<=$(=Date(Max(MonthYear)))"}>} Aggr(
RangeSum(Above(Sum({<MonthYear={">=$(=Date(AddMonths(Max(MonthYear), -36)))<=$(=Date(Max(MonthYear)))"}
>} Consumption), 0, Month(Only({<MonthYear={">=$(=Date(AddMonths(Max(MonthYear), -36)))<=$(=Date(Max(MonthYear)))"}>} Month))))
, cat, (MonthYear, (NUMERIC))))
bharatkishore
- Mark as New
- Bookmark
- Subscribe
- Mute
- Subscribe to RSS Feed
- Permalink
- Report Inappropriate Content
Thank you so much Sunny Bhai...Thanks a lot..
One question why we have use numeric and what does it do? Is it because of version issue that we have to use numeric.
sunny_talwar
- Mark as New
- Bookmark
- Subscribe
- Mute
- Subscribe to RSS Feed
- Permalink
- Report Inappropriate Content
Monthyear field isn't sorted correctly in the scrip, so I am sorting it within the Aggr() function using NUMERIC sort. Read more here:
bharatkishore
- Mark as New
- Bookmark
- Subscribe
- Mute
- Subscribe to RSS Feed
- Permalink
- Report Inappropriate Content
Thank you Sunny Bhai.
