Unlock a world of possibilities! Login now and discover the exclusive benefits awaiting you.

Announcements
Share your agentic AI experience, learn from others, and earn a new badge: Put Agentic AI to Work
- Qlik Community
- :
- All Forums
- :
- QlikView
- :
- Bar chart
Options
- Subscribe to RSS Feed
- Mark Topic as New
- Mark Topic as Read
- Float this Topic for Current User
- Bookmark
- Subscribe
- Mute
- Printer Friendly Page
Turn on suggestions
Auto-suggest helps you quickly narrow down your search results by suggesting possible matches as you type.
Showing results for

 stonecold111
Creator III
2017-11-29
08:45 AM
- Mark as New
- Bookmark
- Subscribe
- Mute
- Subscribe to RSS Feed
- Permalink
- Report Inappropriate Content
Bar chart
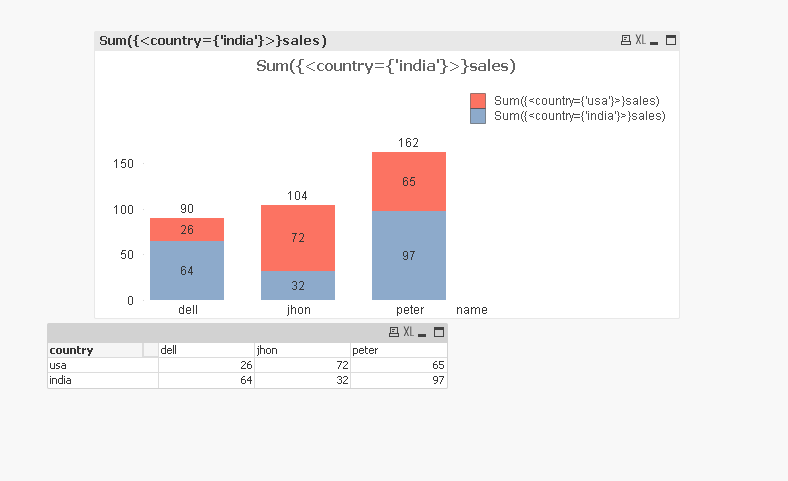
Hi qliks,
I have a bar chart with values on data points.
But I want those values in a list under bar graph as shown above.for that purpose I created a pivot table under bar chart. For example for name dell we have values on data points 26,64 in both bar chart and pivot table.
Here i used sample date which has only three names,but I have 1000 names, so, I want to combine those 2charts and make it one. Or else is there any other possibility in qlikview to show list like that under bar chart.
1,122 Views
1 Solution
Accepted Solutions

 el_aprendiz111
Specialist
2017-11-29
10:38 AM
- Mark as New
- Bookmark
- Subscribe
- Mute
- Subscribe to RSS Feed
- Permalink
- Report Inappropriate Content
3 Replies

 Mark_Little
Luminary
2017-11-29
08:55 AM
- Mark as New
- Bookmark
- Subscribe
- Mute
- Subscribe to RSS Feed
- Permalink
- Report Inappropriate Content
Hi Suresh,
I don't think that it is possible with the standard QlikView Functionality.
Mark
el_aprendiz111
Specialist
2017-11-29
10:38 AM
- Mark as New
- Bookmark
- Subscribe
- Mute
- Subscribe to RSS Feed
- Permalink
- Report Inappropriate Content
Hi Suresh
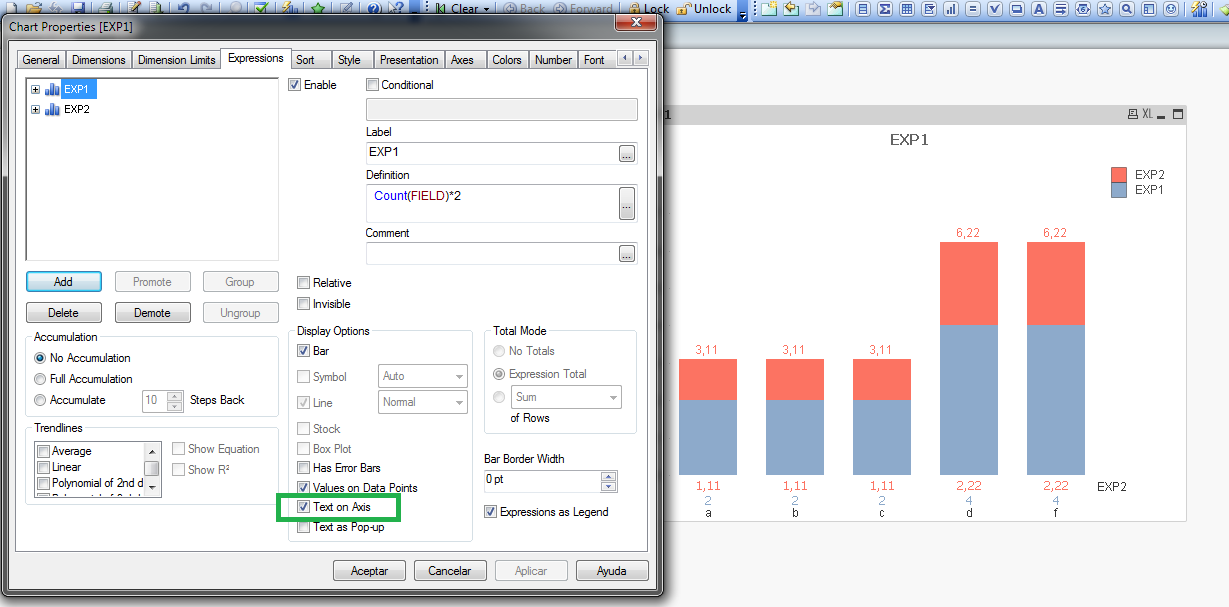
1 Option:
stonecold111
Creator III
2017-11-30
03:41 AM
Author
- Mark as New
- Bookmark
- Subscribe
- Mute
- Subscribe to RSS Feed
- Permalink
- Report Inappropriate Content
Good one. I can manage with this option.
1,043 Views
