Unlock a world of possibilities! Login now and discover the exclusive benefits awaiting you.
- Qlik Community
- :
- All Forums
- :
- QlikView
- :
- Re: Bar chart
- Subscribe to RSS Feed
- Mark Topic as New
- Mark Topic as Read
- Float this Topic for Current User
- Bookmark
- Subscribe
- Mute
- Printer Friendly Page
- Mark as New
- Bookmark
- Subscribe
- Mute
- Subscribe to RSS Feed
- Permalink
- Report Inappropriate Content
Bar chart
Hi,
I have following bar chart:
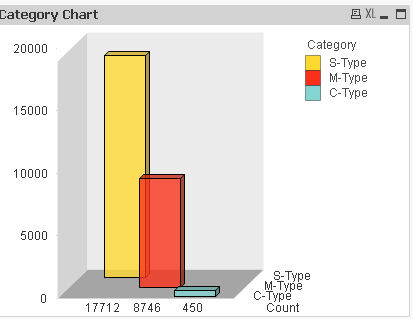
M-Type is sum of M-Type and C-Type.
S-Type is sum of category S-type and M-Type.
This is something implicit and I don't know how to show this on chart.
Kindly help on how to modify this chart to indicate that M-Type has C-Type, S-Type has M-Type.
Thank you!
Accepted Solutions
- Mark as New
- Bookmark
- Subscribe
- Mute
- Subscribe to RSS Feed
- Permalink
- Report Inappropriate Content
- Mark as New
- Bookmark
- Subscribe
- Mute
- Subscribe to RSS Feed
- Permalink
- Report Inappropriate Content
Can u share ur app and expected o/p?
- Mark as New
- Bookmark
- Subscribe
- Mute
- Subscribe to RSS Feed
- Permalink
- Report Inappropriate Content
Hey ..
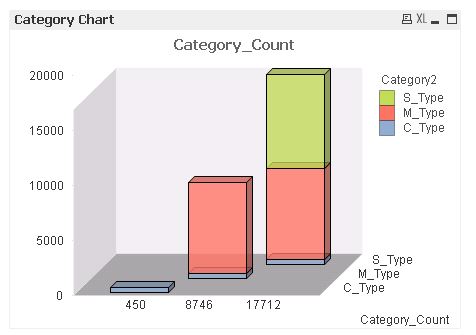
Can you try as below .. if i understood your requirement.
TEMP:
Load * INLINE
[
Parent_Type,Type
M_Type,M_Type
M_type,C_Type
S_Type,S_type
S_Type,M_Type
C_Type,C_Type
];
Attach this TEMP Table to your FACT/DIM table where you've Type
Then on the UI, draw the bar chart with Parent_Type as 1st DIM and Type as 2nd DIM
then Sum(Value).
Hope this Helps.
Thanks
CY
- Mark as New
- Bookmark
- Subscribe
- Mute
- Subscribe to RSS Feed
- Permalink
- Report Inappropriate Content
maybe you could stack the bars like this:
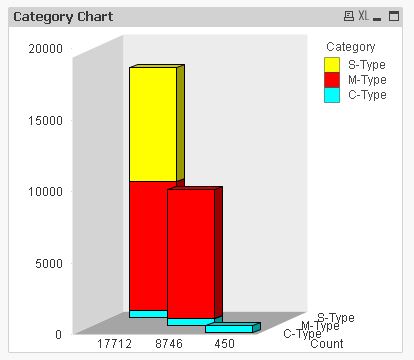
hope this helps
regards
Marco
- Mark as New
- Bookmark
- Subscribe
- Mute
- Subscribe to RSS Feed
- Permalink
- Report Inappropriate Content
Thanks Marco
This looks good!
Can you let me know how to achieve this?
- Mark as New
- Bookmark
- Subscribe
- Mute
- Subscribe to RSS Feed
- Permalink
- Report Inappropriate Content
Sure, can you post a sample application including some data and your expressions to demonstrate?
- Mark as New
- Bookmark
- Subscribe
- Mute
- Subscribe to RSS Feed
- Permalink
- Report Inappropriate Content
I have attached sample application with data. It has one table and is not connected to other tables in my DB model.
- Mark as New
- Bookmark
- Subscribe
- Mute
- Subscribe to RSS Feed
- Permalink
- Report Inappropriate Content
Hi,
example attached:
hope this helps
regards
Marco
- Mark as New
- Bookmark
- Subscribe
- Mute
- Subscribe to RSS Feed
- Permalink
- Report Inappropriate Content
Thanks Marco!