Unlock a world of possibilities! Login now and discover the exclusive benefits awaiting you.

- Qlik Community
- :
- All Forums
- :
- QlikView
- :
- Re: Budget represent
- Subscribe to RSS Feed
- Mark Topic as New
- Mark Topic as Read
- Float this Topic for Current User
- Bookmark
- Subscribe
- Mute
- Printer Friendly Page

 warrentk80
- Mark as New
- Bookmark
- Subscribe
- Mute
- Subscribe to RSS Feed
- Permalink
- Report Inappropriate Content
Budget represent
good morning
I need to represent in a chart table the budget month, the month and the previous month based on the month selected from a list box
tell me someone would know the expression to be inserted
thanks
Andrea
my campodata is dataannomese and in my list box, I can select the month with month (dataannomese)
thanks
Andrea

 manideep78
- Mark as New
- Bookmark
- Subscribe
- Mute
- Subscribe to RSS Feed
- Permalink
- Report Inappropriate Content
Hi Andrea,
Can you be more specific? What exactly you want to show in a chart table? what were the fields involved or could you please give some sample data?
warrentk80
- Mark as New
- Bookmark
- Subscribe
- Mute
- Subscribe to RSS Feed
- Permalink
- Report Inappropriate Content
thanks for the reply.
I want to show the sum of the budget, sending an example attached
manideep78
- Mark as New
- Bookmark
- Subscribe
- Mute
- Subscribe to RSS Feed
- Permalink
- Report Inappropriate Content
For Selected Month:
Sum({<Your_Date_Field={"=Month(Date(Your_Date_Field))"}>}Your_Budget_Field)
For Previous Month:
Sum({<Your_Date_Field={"=Month(Date(Your_Date_Field))-1"}>}Your_Budget_Field)
Hope this helps
Regards,
Manideep
warrentk80
- Mark as New
- Bookmark
- Subscribe
- Mute
- Subscribe to RSS Feed
- Permalink
- Report Inappropriate Content
Thanks for the quick response.
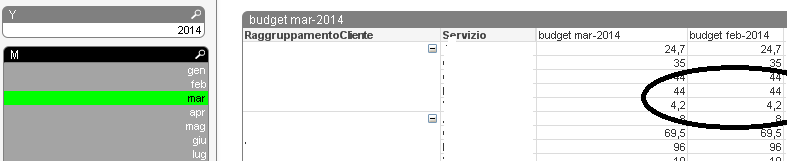
I tried to enter the code that you sent me but in the current year and 2 columns last year I see the same value.
thanks
Andrea
manideep78
- Mark as New
- Bookmark
- Subscribe
- Mute
- Subscribe to RSS Feed
- Permalink
- Report Inappropriate Content
Could you please send me the sample Application for better understading
