Unlock a world of possibilities! Login now and discover the exclusive benefits awaiting you.
- Qlik Community
- :
- All Forums
- :
- QlikView
- :
- Calculated labels in bar chart
- Subscribe to RSS Feed
- Mark Topic as New
- Mark Topic as Read
- Float this Topic for Current User
- Bookmark
- Subscribe
- Mute
- Printer Friendly Page
- Mark as New
- Bookmark
- Subscribe
- Mute
- Subscribe to RSS Feed
- Permalink
- Report Inappropriate Content
Calculated labels in bar chart
I am using grouped bar chart and want to show calculated labels besides bars
Is it possible to achieve it.
Please refer to attached image
regards
anubhav
- Mark as New
- Bookmark
- Subscribe
- Mute
- Subscribe to RSS Feed
- Permalink
- Report Inappropriate Content
As far as I know this not possible
- Mark as New
- Bookmark
- Subscribe
- Mute
- Subscribe to RSS Feed
- Permalink
- Report Inappropriate Content
Hi Anubhav,
I hope it is possible by showing values in Expression, if you check the check box
Values on DataPoint
else you can provide sample data with expected output.so that we will help to you.
- Mark as New
- Bookmark
- Subscribe
- Mute
- Subscribe to RSS Feed
- Permalink
- Report Inappropriate Content
Yes, its possible try like this :
Dual(calculated labels, Your_expression ) then check the show value on data points
- Mark as New
- Bookmark
- Subscribe
- Mute
- Subscribe to RSS Feed
- Permalink
- Report Inappropriate Content
Are you expecting This
https://community.qlik.com/message/1096919?et=watches.email.thread#1096919
If Your answer is this, Yes this is possible.
- Mark as New
- Bookmark
- Subscribe
- Mute
- Subscribe to RSS Feed
- Permalink
- Report Inappropriate Content
another solution might be to put some expressions into the chart and dragging them with ctr+shift to the correct position.
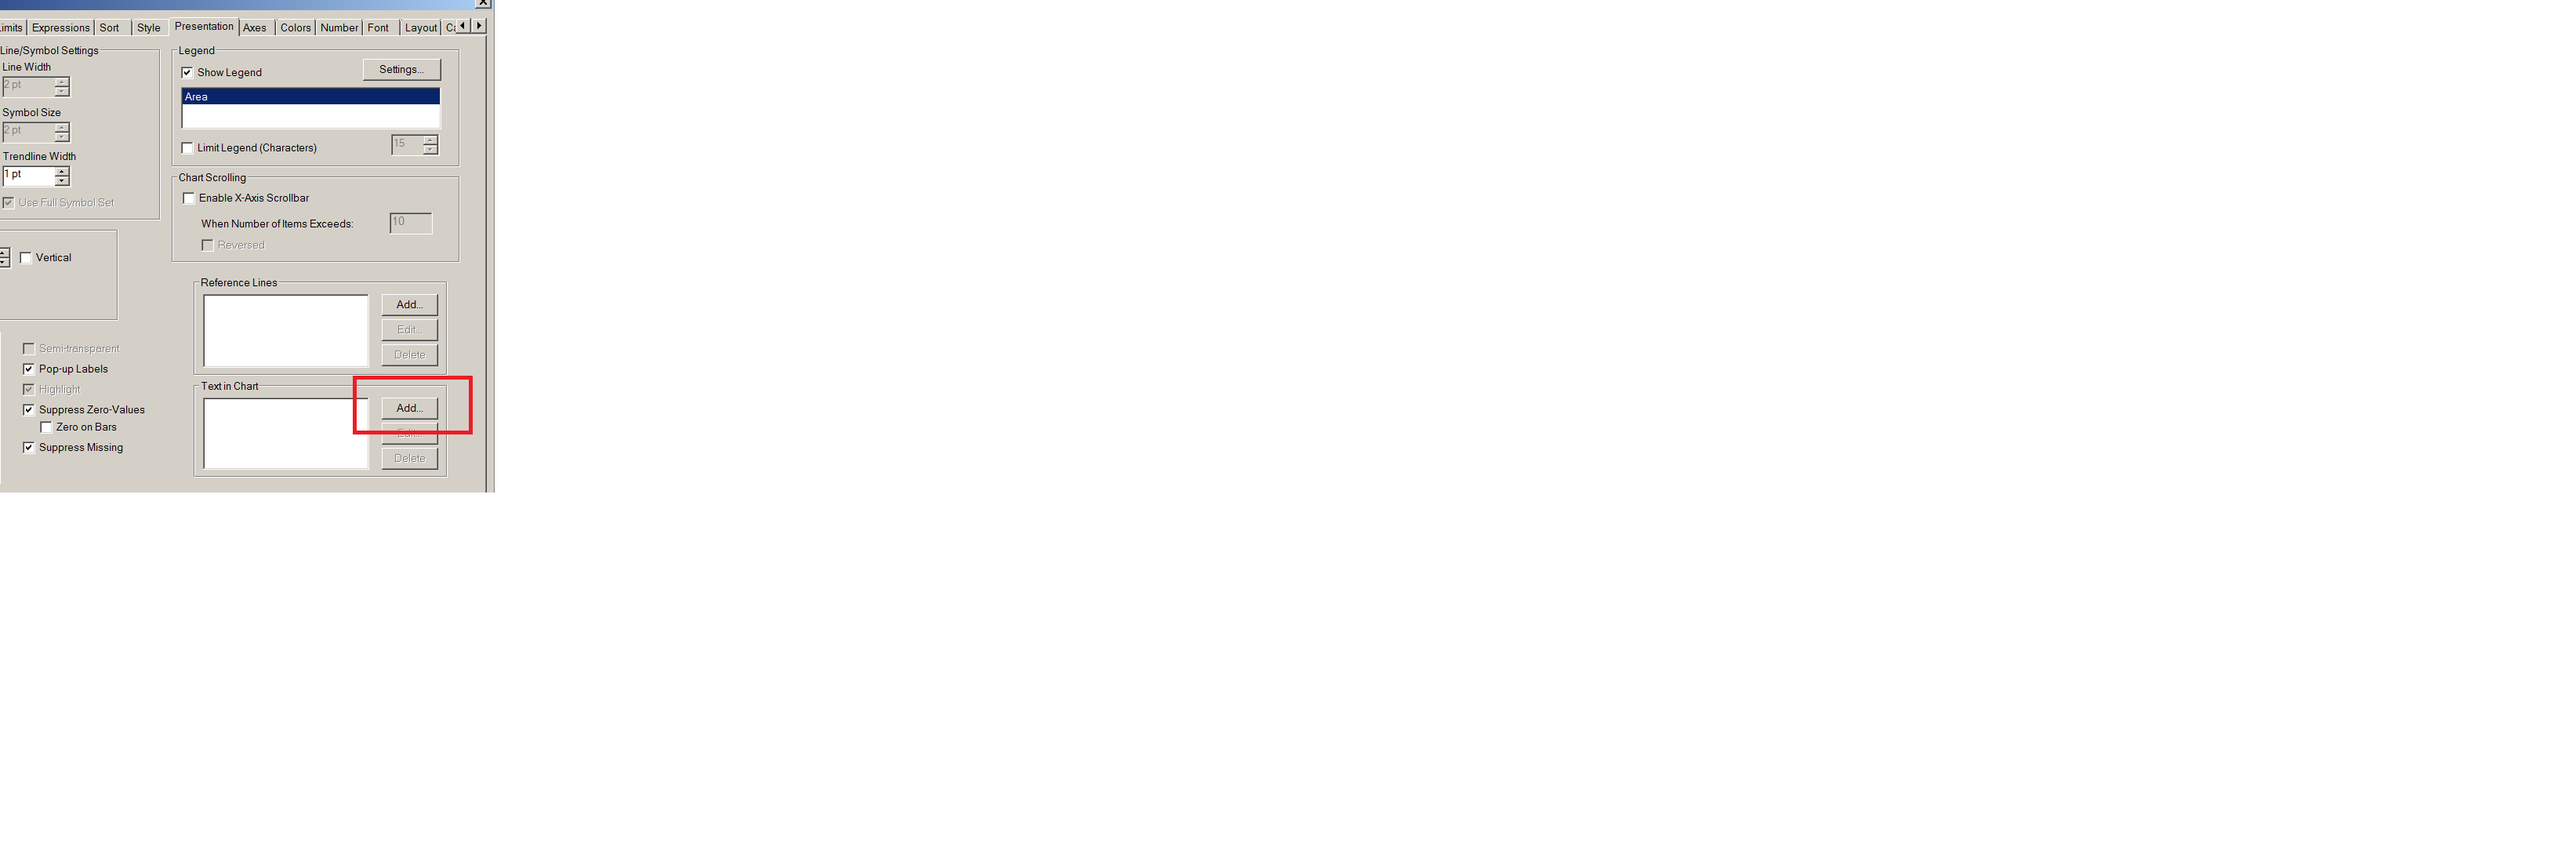
hope this helps
- Mark as New
- Bookmark
- Subscribe
- Mute
- Subscribe to RSS Feed
- Permalink
- Report Inappropriate Content
ya somewhat this but i want it in grouped bar chart.
The solution which you are providing is getting distorted when i switch from stacked to grouped