Unlock a world of possibilities! Login now and discover the exclusive benefits awaiting you.

- Qlik Community
- :
- All Forums
- :
- QlikView
- :
- Re: Calculating Sales
- Subscribe to RSS Feed
- Mark Topic as New
- Mark Topic as Read
- Float this Topic for Current User
- Bookmark
- Subscribe
- Mute
- Printer Friendly Page

- Mark as New
- Bookmark
- Subscribe
- Mute
- Subscribe to RSS Feed
- Permalink
- Report Inappropriate Content
Calculating Sales
Hi All,
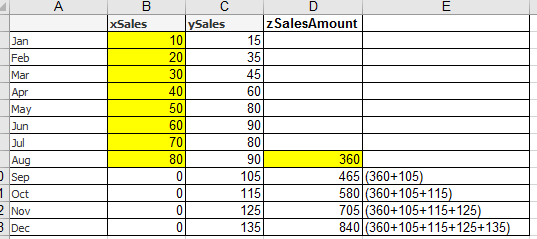
I have the xSales,ySales data on month level.
xSales data is available until August Month.
ySales data is available until December Month.
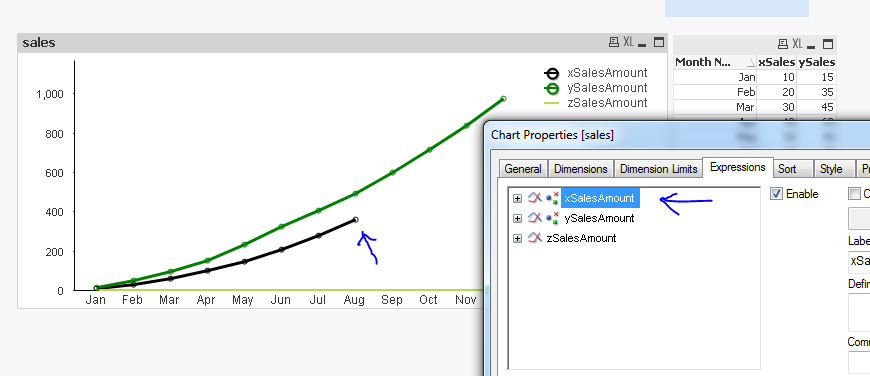
Created a line chart to show xSalesAmount and ySalesAmount as shown in screen.
Want to show new line zSales which is started from August to December.
August zSalesAmount =sum of xSales from Jan to Aug.(360)
September zSalesAmount =sum of xSales from Jan to Aug +Sep ySales (465)
October zSalesAmount =sum of xSales from Jan to Aug +Sep ySales+Oct ySales (580)
.
.
.
December zSalesAmount =sum of xSales from Jan to Aug +Sep ySales+Oct ySales+Nov ySales+Dec ySales (840)
Please help me.
Thanks in advance.
Accepted Solutions

 jagan
jagan
- Mark as New
- Bookmark
- Subscribe
- Mute
- Subscribe to RSS Feed
- Permalink
- Report Inappropriate Content


- Mark as New
- Bookmark
- Subscribe
- Mute
- Subscribe to RSS Feed
- Permalink
- Report Inappropriate Content
Have you check this
Missing Manual - Above() and Below()
- Mark as New
- Bookmark
- Subscribe
- Mute
- Subscribe to RSS Feed
- Permalink
- Report Inappropriate Content
Hi loveisfail
I checked it but did not understood.Please help me.
- Mark as New
- Bookmark
- Subscribe
- Mute
- Subscribe to RSS Feed
- Permalink
- Report Inappropriate Content
Ok, How you are calculating 360
- Mark as New
- Bookmark
- Subscribe
- Mute
- Subscribe to RSS Feed
- Permalink
- Report Inappropriate Content
360 is the sum of xSalesAmount using the below formula:
=if(GetSelectedCount(Year)=0,
IF(Sum({<Date = {"$(='>=' & Date(YearStart(Max(Date)), 'DD-MMM-YY') & '<=' & Date(Max(Date), 'DD-MMM-YY'))"},[Month Name]=, Month=, Year>}xSales),
Rangesum(Sum({<Date = {"$(='>=' & Date(YearStart(Max(Date)), 'DD-MMM-YY') & '<=' & Date(Max(Date), 'DD-MMM-YY'))"},[Month Name]=, Month=, Year>}xSales),Above("xSalesAmount"))),
IF(Sum({<Date =,[Month Name]=, Month=>}xSales),
Rangesum(Sum({<Date = ,[Month Name]=, Month=>}xSales),Above("xSalesAmount")))
)
360 is the sum of xSales from Jan to Aug.
 florentina_doga
- Mark as New
- Bookmark
- Subscribe
- Mute
- Subscribe to RSS Feed
- Permalink
- Report Inappropriate Content
use this script
SalesData:
load *, month(Date) as [Month Name],Date#(SalesDate,'MMM-YY') as Month,Year(Date) as Year;
load Date(Date#(SalesDate,'MMM-YY'),'DD-MMM-YY') as Date,SalesDate,xSales,ySales inline [
SalesDate,xSales,ySales
Jan-16,10,15
Feb-16,20,35
Mar-16,30,45
Apr-16,40,60
May-16,50,80
Jun-16,60,90
Jul-16,70,80
Aug-16,80,90
Sep-16,,105
Oct-16,,115
Nov-16,,125
Dec-16,,135
];
left join
load
sum(xSales) as tt
resident SalesData;
//NoConcatenate
SalesData1:
load *,
if(len(xx)<>0, if(xx<>tt,0,xx),previous(peek('zsalesamount'))+ySales) as zsalesamount;
load *,
if(xSales<>0,if(row=1,xSales,previous(peek('xx'))+xSales),0) as xx;
load
*,
recno() as row
resident SalesData;
drop table SalesData;
rename table SalesData1 to SalesData;
- Mark as New
- Bookmark
- Subscribe
- Mute
- Subscribe to RSS Feed
- Permalink
- Report Inappropriate Content
Are you expecting this
sum(aggr(rangesum(above(total sum({<[Month Name]=>}xSales),0,12)),[Month Name]))

jagan
- Mark as New
- Bookmark
- Subscribe
- Mute
- Subscribe to RSS Feed
- Permalink
- Report Inappropriate Content
Hi,
Check this file.
Regards,
Jagan.
jagan
- Mark as New
- Bookmark
- Subscribe
- Mute
- Subscribe to RSS Feed
- Permalink
- Report Inappropriate Content
Done like this.
Variable: vMaxXSalesDate =Max({<xSales={'>0'}>}Date)
Expression: =Sum({<Date={'<=$(=vMaxXSalesAmount)'}>}xSales) + Sum({<Date={'>$(=vMaxXSalesAmount)'}>}ySales)
and select Full Accumulation option in Expression tab for the above expression.
Hope this helps you.
Regards,
Jagan.