Unlock a world of possibilities! Login now and discover the exclusive benefits awaiting you.

- Qlik Community
- :
- All Forums
- :
- QlikView
- :
- Calculation on the last 12 months in a chart
- Subscribe to RSS Feed
- Mark Topic as New
- Mark Topic as Read
- Float this Topic for Current User
- Bookmark
- Subscribe
- Mute
- Printer Friendly Page

- Mark as New
- Bookmark
- Subscribe
- Mute
- Subscribe to RSS Feed
- Permalink
- Report Inappropriate Content
Calculation on the last 12 months in a chart
Hello,
i met an problem with an chart i want to create but i can't i dont know why it doesn't work...
i try to have the total of an indicator during the last 12 month and for every month (of the current year (or max year) ).
My set analysis is :
=Sum({$<Année=,Mois=,Période=,Date={">=$(=MonthStart(AddMonths(Max([Date]),-12))) <$(=MonthEnd(Max([Date])))"}>}[indicator])
As you can see on the print , the "MonthStart(AddMonths(Max([Date]),-12)))" and the "MonthEnd(Max([Date])" give me the good period for every month but the final calculation is wrong and i don t know the origin of the problem...
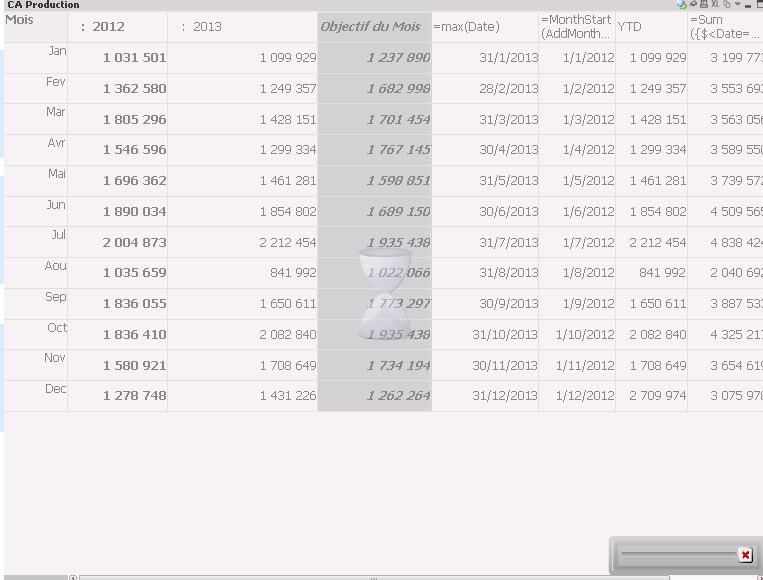
if somebody could help me...
Thanks
Regards

 Gysbert_Wassena
- Mark as New
- Bookmark
- Subscribe
- Mute
- Subscribe to RSS Feed
- Permalink
- Report Inappropriate Content
Set analysis expression calculate one set per chart, not a set per row. If you use Mois as dimension and want a rolling 12 month sum per month you can use an AsOf table. See this document for a description of the problem and possible solutions: Calculating rolling n-period totals, averages or other aggregations
talk is cheap, supply exceeds demand