Unlock a world of possibilities! Login now and discover the exclusive benefits awaiting you.

Announcements
Want to see what's currently in public preview? We've pulled it all together in one place. Check it out here
- Qlik Community
- :
- All Forums
- :
- QlikView
- :
- Chart Expression show
Options
- Subscribe to RSS Feed
- Mark Topic as New
- Mark Topic as Read
- Float this Topic for Current User
- Bookmark
- Subscribe
- Mute
- Printer Friendly Page
Turn on suggestions
Auto-suggest helps you quickly narrow down your search results by suggesting possible matches as you type.
Showing results for

 QSense
Creator II
2012-11-16
06:59 AM
- Mark as New
- Bookmark
- Subscribe
- Mute
- Subscribe to RSS Feed
- Permalink
- Report Inappropriate Content
Chart Expression show
İn my chart ,
I have two expression
one of them is quantity of request opening date more than 30 days : =Count({<ISTEK_ACISTARIHI2 = {"<=$(=Timestamp(Today() - 30, 'DD.MM.YYYY hh:mm:ss'))"},ISTEK_DURUM={'Açık'}>} ISTEK_ACISTARIHI2) 1 aydan uzun süredir Açık İstek Adedi
other expression is only quantity of requests : count(IF(ISTEK_DURUM='Açık',ISTEK_DURUM)) Açık İstek Adedi
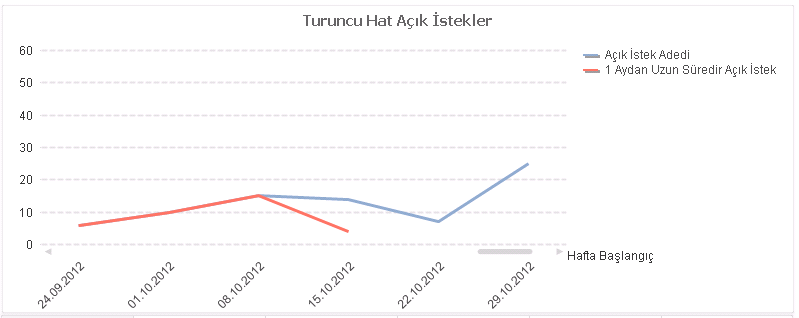
but in chart "açık istek adedi" (Blue one)expression is shown for only 30 days How can I make it show through all dates like red expression
457 Views
1 Reply
QSense
Creator II
2012-11-16
07:25 AM
Author
- Mark as New
- Bookmark
- Subscribe
- Mute
- Subscribe to RSS Feed
- Permalink
- Report Inappropriate Content
These two expressions are overlaped so I can not see one of them
357 Views
