Unlock a world of possibilities! Login now and discover the exclusive benefits awaiting you.

- Qlik Community
- :
- All Forums
- :
- QlikView
- :
- Re: Chart dimension issue?
- Subscribe to RSS Feed
- Mark Topic as New
- Mark Topic as Read
- Float this Topic for Current User
- Bookmark
- Subscribe
- Mute
- Printer Friendly Page

- Mark as New
- Bookmark
- Subscribe
- Mute
- Subscribe to RSS Feed
- Permalink
- Report Inappropriate Content
Chart dimension issue?
Hi Folks,
I have Dimension values like 1,2,3.....100
I want to use dimension values in X-Axies like below
1-10% 11-20% 21-30% 31-40% 41-50% 51-60% 61-70% 71-80% 81-90% 91-100% More(if we have morethan 100)
i have used the Class() function but it is giving the result like below
0<=x<10 11<=x<20 21<=x<30 31<=x<40 41<=x<50 51<=x<60 61<=x<70 71<=x<80 81<=x<90 91<=x<100 100<=x<110(More)
Here i don't want X between the intervals and also here if i am having morethan 100 i vl get 100<=x<110 instead of More.
Thanks,
Rakesh

 its_anandrjs
- Mark as New
- Bookmark
- Subscribe
- Mute
- Subscribe to RSS Feed
- Permalink
- Report Inappropriate Content
Hi,
You can try this expression and replace the <= x < string and concatenate % symbol but if your expression calculates the % values then it is better you can use this expression
=Replace(Class(Attendees,10),'<= x <', '-')&'%'
Regards
Anand
its_anandrjs
- Mark as New
- Bookmark
- Subscribe
- Mute
- Subscribe to RSS Feed
- Permalink
- Report Inappropriate Content
Hi,
In dimension you can try this ways also assume this example
LOAD
RecNo() as Id,
Rand()*100 as Amt
AutoGenerate(150);
And in the straight table chart
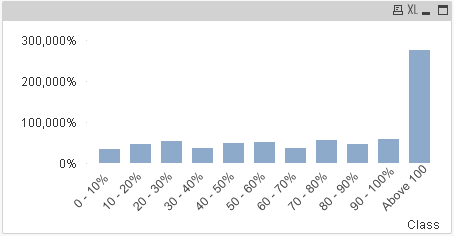
Dim:- =if(Id<100, Replace(Class(Id,10),'<= x <', '-')&'%', 'Above 100')
Expre:- sum(Amt)
But check the expression should calculate % in your expression it is example.
Regards
Anand