Unlock a world of possibilities! Login now and discover the exclusive benefits awaiting you.

Announcements
Share your agentic AI experience, learn from others, and earn a new badge: Put Agentic AI to Work
- Qlik Community
- :
- All Forums
- :
- QlikView
- :
- Re: Chart , rate
Options
- Subscribe to RSS Feed
- Mark Topic as New
- Mark Topic as Read
- Float this Topic for Current User
- Bookmark
- Subscribe
- Mute
- Printer Friendly Page
Turn on suggestions
Auto-suggest helps you quickly narrow down your search results by suggesting possible matches as you type.
Showing results for

 QSense
Creator II
2012-04-27
02:08 AM
- Mark as New
- Bookmark
- Subscribe
- Mute
- Subscribe to RSS Feed
- Permalink
- Report Inappropriate Content
Chart , rate
Hi ,
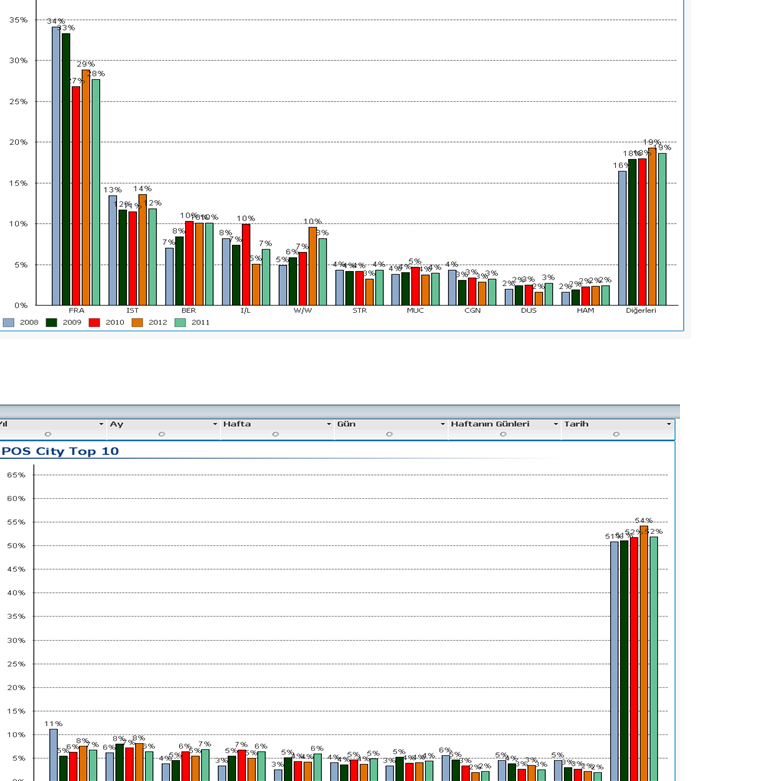
In first chartI have a rate for instance 16 % When I clicked on this rate,
I want to see in second chart the total rate 16% not 100%
How can I do?
1,764 Views
3 Replies
QSense
Creator II
2012-04-27
02:08 AM
Author
- Mark as New
- Bookmark
- Subscribe
- Mute
- Subscribe to RSS Feed
- Permalink
- Report Inappropriate Content
1,415 Views

 varunpbhandary
Partner - Contributor III
2012-04-27
02:45 AM
- Mark as New
- Bookmark
- Subscribe
- Mute
- Subscribe to RSS Feed
- Permalink
- Report Inappropriate Content
Hi ,
You can use Set analysis to capture the total sales figure then find the relative % of the Dimension.
PFA an crude example.
Cheers!
QSense
Creator II
2012-04-27
03:00 AM
Author
- Mark as New
- Bookmark
- Subscribe
- Mute
- Subscribe to RSS Feed
- Permalink
- Report Inappropriate Content
Hi
My expression is
Sum(CPN_BSD_BRD_PX)
/
Sum(Total <CalendarDate> CPN_BSD_BRD_PX)
How should I do?
1,415 Views
