Unlock a world of possibilities! Login now and discover the exclusive benefits awaiting you.

- Qlik Community
- :
- All Forums
- :
- QlikView
- :
- Color in Gauge Chart
- Subscribe to RSS Feed
- Mark Topic as New
- Mark Topic as Read
- Float this Topic for Current User
- Bookmark
- Subscribe
- Mute
- Printer Friendly Page

- Mark as New
- Bookmark
- Subscribe
- Mute
- Subscribe to RSS Feed
- Permalink
- Report Inappropriate Content
Color in Gauge Chart
Hi
I am trying to show a bar in a straight table which has its color depending on a value
e.g. red if below 1 and green if above it
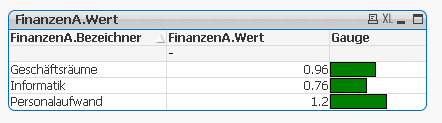
I have adjusted the gauge setting to:
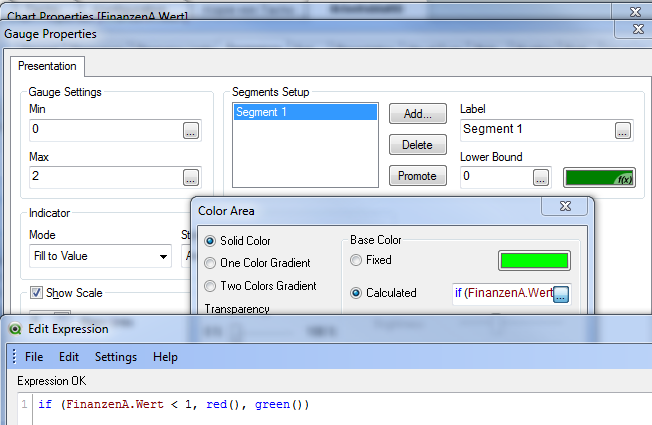
the bar however always shows up in green? In the first 2 rows I wanted it to be red().

 stabben23
- Mark as New
- Bookmark
- Subscribe
- Mute
- Subscribe to RSS Feed
- Permalink
- Report Inappropriate Content
Hi,
use sum in our expression, now it will count FinanzenA.Wert and it always 1.
like this if(sum(FinanzenA.Wert <1,red(),green()))
and maybe you shold use aggr on your dimension, like if(aggr(sum(FinanzenA.Wert),FinanzenA.Bezeichner)<1........
//Staffan
- Mark as New
- Bookmark
- Subscribe
- Mute
- Subscribe to RSS Feed
- Permalink
- Report Inappropriate Content
Hi
the formula you gave looks to have a syntax problem
I used if (sum(FinanzenA.Wert) < 1, red(), green())
but this does not change the color either
Juerg
stabben23
- Mark as New
- Bookmark
- Subscribe
- Mute
- Subscribe to RSS Feed
- Permalink
- Report Inappropriate Content
Hi,
use a aggr function if(sum(aggr(sum(FinanzenA.Wert),FinanzenA.Bezeichner)<1,red(),green()))
//Staffan
- Mark as New
- Bookmark
- Subscribe
- Mute
- Subscribe to RSS Feed
- Permalink
- Report Inappropriate Content
Thanks Staffan for your quick replies - however your formula still has a syntax problem and my changes to make it work have so far been of no success
Juerg
P.S. just saw that the color adjust correctly if only a single row is selected ...