Unlock a world of possibilities! Login now and discover the exclusive benefits awaiting you.
- Qlik Community
- :
- All Forums
- :
- QlikView
- :
- Re: Colors in chart
- Subscribe to RSS Feed
- Mark Topic as New
- Mark Topic as Read
- Float this Topic for Current User
- Bookmark
- Subscribe
- Mute
- Printer Friendly Page
- Mark as New
- Bookmark
- Subscribe
- Mute
- Subscribe to RSS Feed
- Permalink
- Report Inappropriate Content
Colors in chart
Hi community,
I have bar chart with 1 dimension ( 8 tags) and 1 expression. I need that each tag has different color.
I know in expressions tab has Background Color, where I can code for each tag own color.
But when tags will be different of my coding, I get the same color for all not coding tags.
Please help me to make it automatically.
Thanks,
- Tags:
- new_to_qlikview
Accepted Solutions
- Mark as New
- Bookmark
- Subscribe
- Mute
- Subscribe to RSS Feed
- Permalink
- Report Inappropriate Content
Maybe like attached?
- Mark as New
- Bookmark
- Subscribe
- Mute
- Subscribe to RSS Feed
- Permalink
- Report Inappropriate Content
Maybe like attached?
- Mark as New
- Bookmark
- Subscribe
- Mute
- Subscribe to RSS Feed
- Permalink
- Report Inappropriate Content
Hello Vladimir,
In order to achieve this, you might want to define the background color of your expression in your chart, as such:
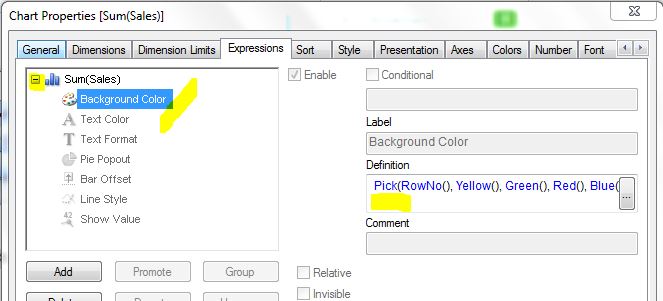
Under the Definition field, you may enter any expression you wish to build that returns either a color, or a reference to the current color palette as defined under the "Colors" tab.
The expression used above is Pick(RowNo(), Yellow(), Green(), Red(), Blue() ), which evaluates the row number for each different value of the selected dimension (in this case, I had 4), and based on that value, picks a color using the defined order, such as 1=Yellow, 2=Green, 3=Red and 4=Blue. Of course, you may opt to replace these colors with a more specific color coding using the RGB(n,n,n) function, with n=[0..255].
In order to reuse the current color scheme, the expression is a lot simpler: Color(RowNo()). In this case, the row number shall be used to pick the color from the color palette as defined under the "Colors", in their specified order.
Hope this helps, regards,
Philippe