Unlock a world of possibilities! Login now and discover the exclusive benefits awaiting you.

- Qlik Community
- :
- All Forums
- :
- QlikView
- :
- Re: Combining dimensions into one in chart
- Subscribe to RSS Feed
- Mark Topic as New
- Mark Topic as Read
- Float this Topic for Current User
- Bookmark
- Subscribe
- Mute
- Printer Friendly Page

 jessica_webb
- Mark as New
- Bookmark
- Subscribe
- Mute
- Subscribe to RSS Feed
- Permalink
- Report Inappropriate Content
Combining dimensions into one in chart
I have the following data table:
| ID | Target | Current |
|---|---|---|
| 32456 | 1 | 3 |
| 9754 | 5 | 2 |
| 3215 | 6 | 4 |
| 7512 | 2 | 7 |
| 3254 | 4 | 5 |
'Target' and 'Current' share the same values.
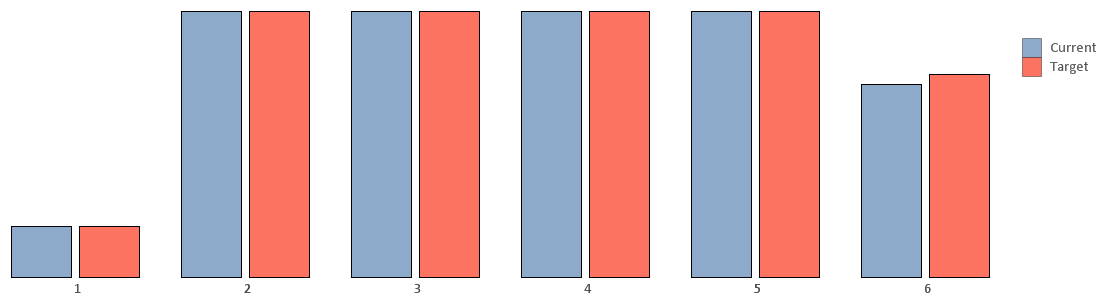
How can I create a chart like this, where I have COUNT(ID) as the expression, and the two dimensions as one?
- « Previous Replies
-
- 1
- 2
- Next Replies »
jessica_webb
- Mark as New
- Bookmark
- Subscribe
- Mute
- Subscribe to RSS Feed
- Permalink
- Report Inappropriate Content
Thanks for the response. Would there be anyway to do this directly in the chart?
I'm having real troubles getting a new dimension into the script:

 oscar_ortiz
- Mark as New
- Bookmark
- Subscribe
- Mute
- Subscribe to RSS Feed
- Permalink
- Report Inappropriate Content
Jessica,
Are you trying to produce something like this?

Good luck
Oscar
jessica_webb
- Mark as New
- Bookmark
- Subscribe
- Mute
- Subscribe to RSS Feed
- Permalink
- Report Inappropriate Content
Hi Oscar,
Thank you, but not quite...
The values for target and current aren't countable numbers - they're nominal.
So for example:
| ID | Target | Current |
|---|---|---|
| 32456 | A | C |
| 9754 | E | B |
| 3215 | F | D |
| 7512 | B | G |
| 3254 | D | E |
So what I need is a count of each instance - not a sum...

 Kushal_Chawda
- Mark as New
- Bookmark
- Subscribe
- Mute
- Subscribe to RSS Feed
- Permalink
- Report Inappropriate Content
Hi Jessica,
As per your requirement you need to change the structure of your data through script, that means it will be quite complex to do this on front end, perhaps I don't think that will be possible on front end.
oscar_ortiz
- Mark as New
- Bookmark
- Subscribe
- Mute
- Subscribe to RSS Feed
- Permalink
- Report Inappropriate Content
Maybe something like this then?

Good luck
Oscar

 qliksus
- Mark as New
- Bookmark
- Subscribe
- Mute
- Subscribe to RSS Feed
- Permalink
- Report Inappropriate Content
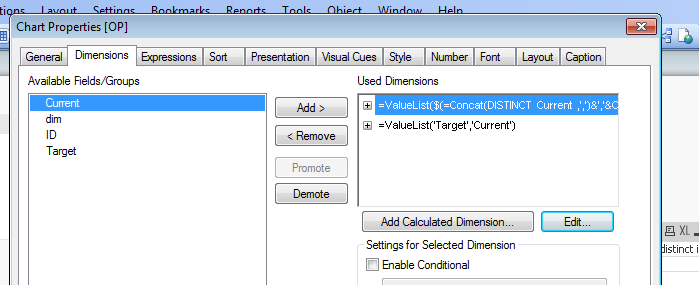
Just tweak the expression and add one more dimension
Dimension1: ValueList($(=Concat(DISTINCT Current ,',')&','&Concat(DISTINCT Target ,',')))
Dimension2 : =ValueList('Target','Current')
Expression : count(distinct if(Current=ValueList($(=Concat(DISTINCT Current ,',')&','&Concat(DISTINCT Target ,','))) and ValueList('Target','Current')='Current' , ID)) +
count(distinct if(Target=ValueList($(=Concat(DISTINCT Current ,',')&','&Concat(DISTINCT Target ,','))) and ValueList('Target','Current')='Target', ID))

jessica_webb
- Mark as New
- Bookmark
- Subscribe
- Mute
- Subscribe to RSS Feed
- Permalink
- Report Inappropriate Content
Would you be able to provide me with your sample file that you did this in?
I've tried copying it into my own application, but it doesn't work for me...
jessica_webb
- Mark as New
- Bookmark
- Subscribe
- Mute
- Subscribe to RSS Feed
- Permalink
- Report Inappropriate Content
But the data in your chart is incorrect. For example, you're showing a count of 1 for 'Target - C', but that should be 0
qliksus
- Mark as New
- Bookmark
- Subscribe
- Mute
- Subscribe to RSS Feed
- Permalink
- Report Inappropriate Content
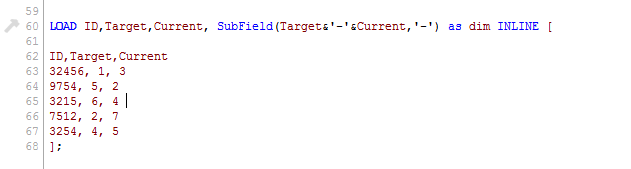
Attaching is restricted in my network so pasting the screenshot of what I have done can you post the error you are getting ?


- « Previous Replies
-
- 1
- 2
- Next Replies »