Unlock a world of possibilities! Login now and discover the exclusive benefits awaiting you.

- Qlik Community
- :
- All Forums
- :
- QlikView
- :
- Combo chart issue while Plotting Normal Distributi...
- Subscribe to RSS Feed
- Mark Topic as New
- Mark Topic as Read
- Float this Topic for Current User
- Bookmark
- Subscribe
- Mute
- Printer Friendly Page

 manideep78
- Mark as New
- Bookmark
- Subscribe
- Mute
- Subscribe to RSS Feed
- Permalink
- Report Inappropriate Content
Combo chart issue while Plotting Normal Distribution
Dear Community,
I am developing a normal distribution chart using a Combo chart. I have some issues with the bars and Lines as well
In the attached image bars shows continuity. That means they are touching with each other. I tried to manage this using scale But i had no luck. I also need Vertical LSL and USL values at -0.2 and 0.2 respectively(it will be visible if i dont make any selections. But It should display for any selections.)
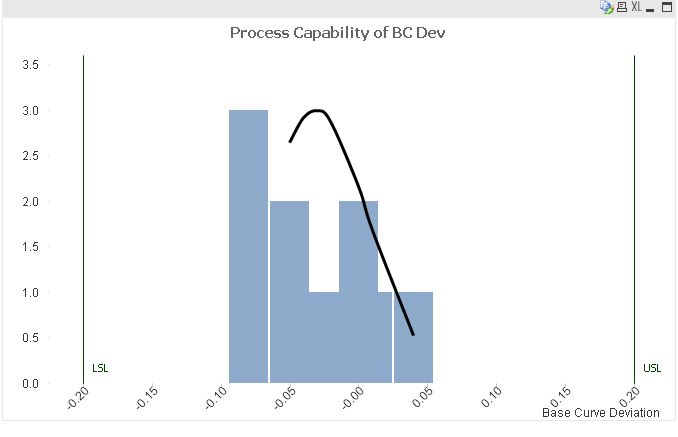
The line starts some where above in the graph but it should start at 0 even though there are no values for getting 0.
I am also attaching the sample image of my graph how it looks in SAS. I need to do the same report in Qlikview.
Please find the sample App attached.
Please help me in achieving this.
Thanks a ton in advance.
Regards
Manideep


 srchilukoori
- Mark as New
- Bookmark
- Subscribe
- Mute
- Subscribe to RSS Feed
- Permalink
- Report Inappropriate Content
The issue is with the BC_DEV available for the "B00GZBZ" Lot. It is limited to -0.080 to 0,040.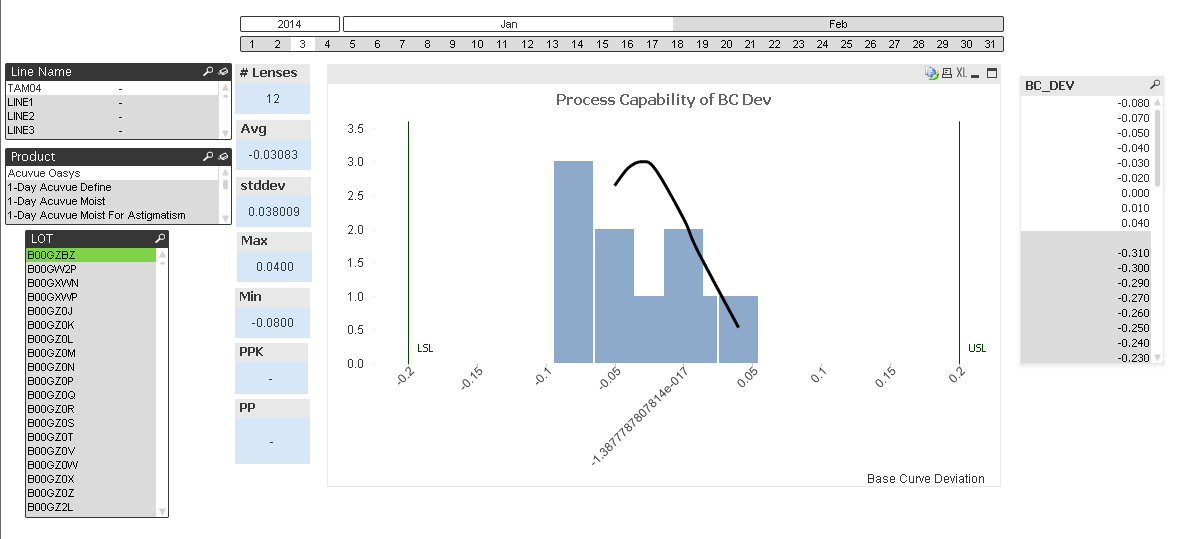
Hence you are not getting the zero values.
SC
