Unlock a world of possibilities! Login now and discover the exclusive benefits awaiting you.

- Qlik Community
- :
- All Forums
- :
- QlikView
- :
- Re: Comparative Analysis
- Subscribe to RSS Feed
- Mark Topic as New
- Mark Topic as Read
- Float this Topic for Current User
- Bookmark
- Subscribe
- Mute
- Printer Friendly Page

- Mark as New
- Bookmark
- Subscribe
- Mute
- Subscribe to RSS Feed
- Permalink
- Report Inappropriate Content
Comparative Analysis
I have the following chart which i am using for comparative analysis of two groups namely Group A vs Group B:
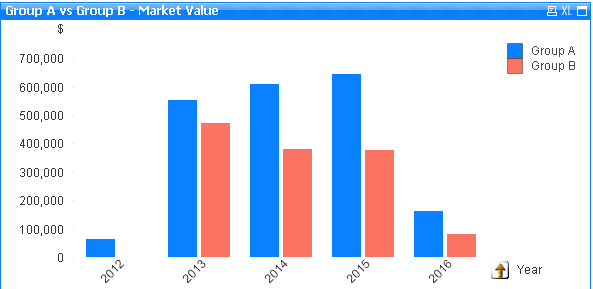
The expressions for the two groups are as follows:


Now i want to use Moving Annual Totals instead of straight sum to do the comparisons. I have modified the two expressions to be as follows using the AsOfMonths set analysis:


Amount = ([MedAid Amount] + Shortfall)
However the comparative analysis does not work and i get the following graph:
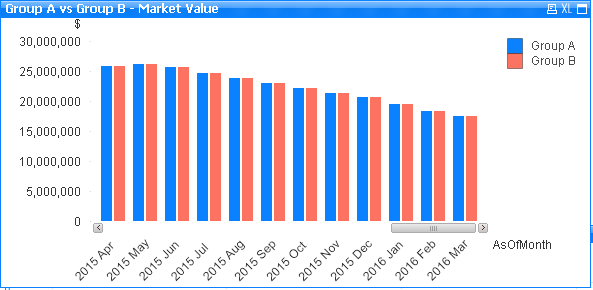
The MAT values are for the whole data sets and not the respective groups and the two values for Group A and B are the same. How can i solve my problem.
Regards
Chris
Accepted Solutions

 sunny_talwar
- Mark as New
- Bookmark
- Subscribe
- Mute
- Subscribe to RSS Feed
- Permalink
- Report Inappropriate Content
May be this:
Sum({[Group A] * $<MonthDiff = {"<12"}>} Amount)
or
Sum({[Group A] * $}*{$<MonthDiff = {"<12"}>} Amount)
sunny_talwar
- Mark as New
- Bookmark
- Subscribe
- Mute
- Subscribe to RSS Feed
- Permalink
- Report Inappropriate Content
May be this:
Sum({[Group A] * $<MonthDiff = {"<12"}>} Amount)
or
Sum({[Group A] * $}*{$<MonthDiff = {"<12"}>} Amount)
- Mark as New
- Bookmark
- Subscribe
- Mute
- Subscribe to RSS Feed
- Permalink
- Report Inappropriate Content
Thanks Sunny, i used the first expression and it is working
Regards