Unlock a world of possibilities! Login now and discover the exclusive benefits awaiting you.

- Qlik Community
- :
- All Forums
- :
- QlikView
- :
- Re: Convert into chart
- Subscribe to RSS Feed
- Mark Topic as New
- Mark Topic as Read
- Float this Topic for Current User
- Bookmark
- Subscribe
- Mute
- Printer Friendly Page

 Nagaraju_KCS
- Mark as New
- Bookmark
- Subscribe
- Mute
- Subscribe to RSS Feed
- Permalink
- Report Inappropriate Content
Convert into chart
Hi Community,
PFA,
I have used all text boxes, it looks like chart only.
But, when i am making selections, performance very slow.
How to convert chart level..??
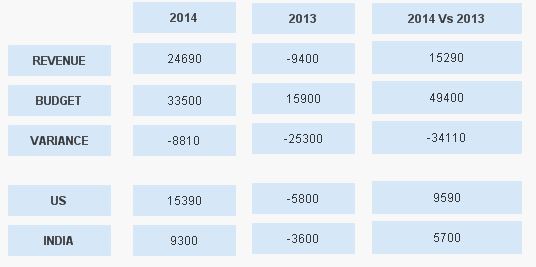
Here Revenue, Budget and Variance after that i want to show empty line..
then US and INDIA.
Thanks in Advance...
Accepted Solutions

 sunny_talwar
- Mark as New
- Bookmark
- Subscribe
- Mute
- Subscribe to RSS Feed
- Permalink
- Report Inappropriate Content
sunny_talwar
- Mark as New
- Bookmark
- Subscribe
- Mute
- Subscribe to RSS Feed
- Permalink
- Report Inappropriate Content
Can be done, but don't know if you will be able to achieve any performance benefits
Nagaraju_KCS
- Mark as New
- Bookmark
- Subscribe
- Mute
- Subscribe to RSS Feed
- Permalink
- Report Inappropriate Content
HI Sunny,
But here something different, I don't have any dimension.
How can i achieve this ???
sunny_talwar
- Mark as New
- Bookmark
- Subscribe
- Mute
- Subscribe to RSS Feed
- Permalink
- Report Inappropriate Content
Using synthetic dimension or Island Table. The problem remains that the expressions won't change (causing the same slow down issue)

 Clever_Anjos
- Mark as New
- Bookmark
- Subscribe
- Mute
- Subscribe to RSS Feed
- Permalink
- Report Inappropriate Content
PFA
Clever_Anjos
- Mark as New
- Bookmark
- Subscribe
- Mute
- Subscribe to RSS Feed
- Permalink
- Report Inappropriate Content
As Sunny said, the only speed performance will be in 3rd column, since it can be rewriten as column(1) + column(2) avoid recalculating
Nagaraju_KCS
- Mark as New
- Bookmark
- Subscribe
- Mute
- Subscribe to RSS Feed
- Permalink
- Report Inappropriate Content
Thanks Clever,
Can we show, Empty line.
Like this..
| Dimension | 2014 | 2013 | Column(1)+Column(2) |
| REVENUE | 24690 | -9400 | 15290 |
| BUDGET | 33500 | 15900 | 49400 |
| VARIANCE | -8810 | -25300 | -34110 |
| US | 15390 | -5800 | 9590 |
| INDIA | 9300 | -3600 | 5700 |
sunny_talwar
- Mark as New
- Bookmark
- Subscribe
- Mute
- Subscribe to RSS Feed
- Permalink
- Report Inappropriate Content
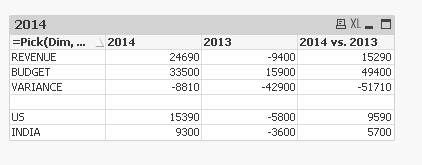
This?
Clever_Anjos
- Mark as New
- Bookmark
- Subscribe
- Mute
- Subscribe to RSS Feed
- Permalink
- Report Inappropriate Content
Try this
Nagaraju_KCS
- Mark as New
- Bookmark
- Subscribe
- Mute
- Subscribe to RSS Feed
- Permalink
- Report Inappropriate Content
Thanks Clever and Sunny,
I have done something... But these two are simple. 
