Unlock a world of possibilities! Login now and discover the exclusive benefits awaiting you.

- Qlik Community
- :
- All Forums
- :
- QlikView
- :
- Re: Coulmn Total
- Subscribe to RSS Feed
- Mark Topic as New
- Mark Topic as Read
- Float this Topic for Current User
- Bookmark
- Subscribe
- Mute
- Printer Friendly Page

- Mark as New
- Bookmark
- Subscribe
- Mute
- Subscribe to RSS Feed
- Permalink
- Report Inappropriate Content
Coulmn Total
Hi All,
I have this requirement in which i have to show calculated total (formula- Ex-=(Sum of OFE – Sum of Error) / Sum of OFE)total at botton of each coulmn,Like for Apr-2014 may 2014 2014-2015 total should be according to the formula above ??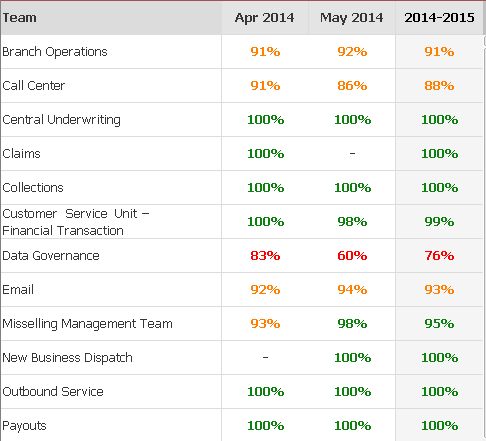
- « Previous Replies
-
- 1
- 2
- Next Replies »

 vardhancse
- Mark as New
- Bookmark
- Subscribe
- Mute
- Subscribe to RSS Feed
- Permalink
- Report Inappropriate Content
Yes for pivot table, this option will be disabled.
Try to convert in to straight table
vardhancse
- Mark as New
- Bookmark
- Subscribe
- Mute
- Subscribe to RSS Feed
- Permalink
- Report Inappropriate Content
In this pivot table, we need to align the field names so that it will come in proper way.
Like drag the fields from row to column
- Mark as New
- Bookmark
- Subscribe
- Mute
- Subscribe to RSS Feed
- Permalink
- Report Inappropriate Content
yes i did try this method
- Mark as New
- Bookmark
- Subscribe
- Mute
- Subscribe to RSS Feed
- Permalink
- Report Inappropriate Content
but its giving me output as 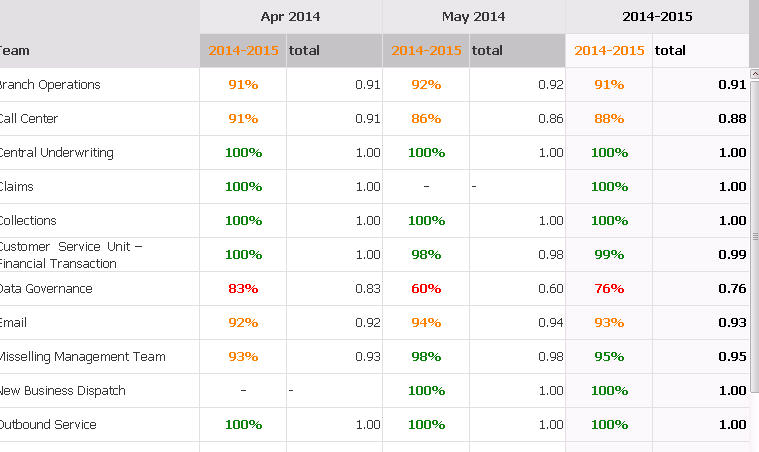
vardhancse
- Mark as New
- Bookmark
- Subscribe
- Mute
- Subscribe to RSS Feed
- Permalink
- Report Inappropriate Content
drag and drop the rows and columns properly

 SunilChauhan
- Mark as New
- Bookmark
- Subscribe
- Mute
- Subscribe to RSS Feed
- Permalink
- Report Inappropriate Content
see the attched example
hope this helps
- Mark as New
- Bookmark
- Subscribe
- Mute
- Subscribe to RSS Feed
- Permalink
- Report Inappropriate Content
hi sasi i tried but am not able to get Total column at the bottom ,how to do that?
vardhancse
- Mark as New
- Bookmark
- Subscribe
- Mute
- Subscribe to RSS Feed
- Permalink
- Report Inappropriate Content
Hi Rohit,
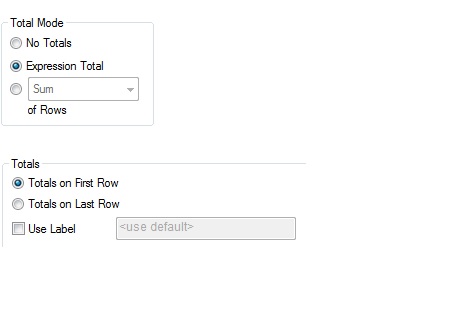
Select Totals on Last Row, u can able to see the total in the last row.
Or
In the chart properties->presentation
Select select Show Partial Sums for the dimensions

- Mark as New
- Bookmark
- Subscribe
- Mute
- Subscribe to RSS Feed
- Permalink
- Report Inappropriate Content
Hello Guys , I want Only Grand total which an expression as total, at the bottom and not the count,grand total as shown in image below in month column,how do i do that,i have also attached sample.qvw in documents kindly check and let me know.

- « Previous Replies
-
- 1
- 2
- Next Replies »