Unlock a world of possibilities! Login now and discover the exclusive benefits awaiting you.

- Qlik Community
- :
- All Forums
- :
- QlikView
- :
- Cumulative MAT in table/chart
- Subscribe to RSS Feed
- Mark Topic as New
- Mark Topic as Read
- Float this Topic for Current User
- Bookmark
- Subscribe
- Mute
- Printer Friendly Page

- Mark as New
- Bookmark
- Subscribe
- Mute
- Subscribe to RSS Feed
- Permalink
- Report Inappropriate Content
Cumulative MAT in table/chart
Hi guys,
I need to have a column in this table that calculates MAT for each of the months.
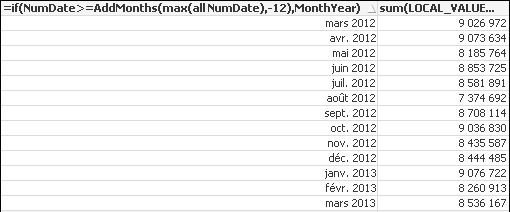
So, in the March 2013 line of this table I need the sum of April 2012 to March 2013 and in the February 2013 I need the sum of March 2012 to February 2013.... and so on.
This table has data until 2010, but in the table/chart I only need the last 13 months.
Thank you in advance.
Kind regards,
Nuno
.png "bbi_mba_76")
 bbi_mba_76
- Mark as New
- Bookmark
- Subscribe
- Mute
- Subscribe to RSS Feed
- Permalink
- Report Inappropriate Content
Hi,
you could have a look at this document Calculating rolling n-period totals, averages or other aggregations
- Mark as New
- Bookmark
- Subscribe
- Mute
- Subscribe to RSS Feed
- Permalink
- Report Inappropriate Content
Thanks. It seems it can only be solved by an AsOf table.
If someone has a different solution using a single expression directly in chart, I would really appreciate it.