Unlock a world of possibilities! Login now and discover the exclusive benefits awaiting you.

- Qlik Community
- :
- All Forums
- :
- QlikView
- :
- Cumulative graph not stacked
- Subscribe to RSS Feed
- Mark Topic as New
- Mark Topic as Read
- Float this Topic for Current User
- Bookmark
- Subscribe
- Mute
- Printer Friendly Page

- Mark as New
- Bookmark
- Subscribe
- Mute
- Subscribe to RSS Feed
- Permalink
- Report Inappropriate Content
Cumulative graph not stacked
Hello everybody.
I have a graph with two expressions, both of them full acumulated.
But in the graph they are cumulated together and presented one above the other.
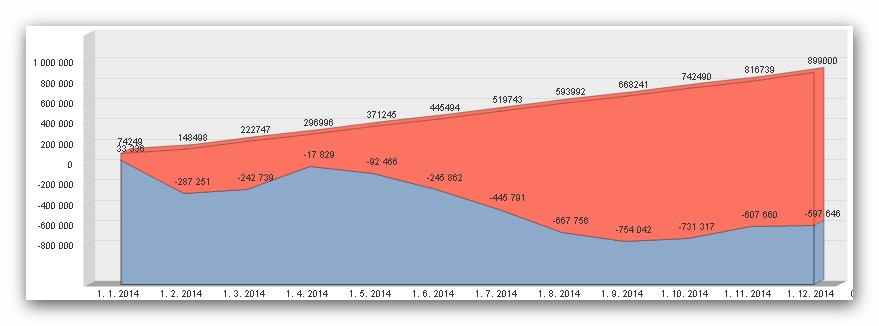
But I need the two expressions not cumulated and presented one behind the other.
How can I achieve this ?
Thanx in advance.
Duski
- Tags:
- graph
- new_to_qlikview

 Gysbert_Wassena
- Mark as New
- Bookmark
- Subscribe
- Mute
- Subscribe to RSS Feed
- Permalink
- Report Inappropriate Content
You can't. Not with one chart that is. You'll have to use two charts and place on on top of the other while making its background transparent.
The kind of chart you seem to want to make is really quite dysfunctional. I recommend you use lines instead of areas. There is no reason at all for using areas and even less to use 3D. Unless the purpose is to obfuscate the data.
talk is cheap, supply exceeds demand