Unlock a world of possibilities! Login now and discover the exclusive benefits awaiting you.

- Qlik Community
- :
- All Forums
- :
- QlikView
- :
- Re: Data Manipulation (Switch Measure for Dimensio...
- Subscribe to RSS Feed
- Mark Topic as New
- Mark Topic as Read
- Float this Topic for Current User
- Bookmark
- Subscribe
- Mute
- Printer Friendly Page

 akpofureenughwu
- Mark as New
- Bookmark
- Subscribe
- Mute
- Subscribe to RSS Feed
- Permalink
- Report Inappropriate Content
Data Manipulation (Switch Measure for Dimension)
Hello everyone.. I have a set of data in this format...
| Location | Year | Quarter | UA | UC | RTA |
|---|---|---|---|---|---|
| Area 1 | 2015 | Q1 | 12 | 1 | 2 |
| Area 2 | 2015 | Q1 | 13 | 1 | 0 |
| Area 1 | 2015 | Q2 | 34 | 2 | 1 |
| Area 2 | 2015 | Q2 | 13 | 2 | 1 |
| Area 1 | 2015 | Q3 | 13 | 1 | 0 |
| Area 2 | 2015 | Q3 | 1 | 2 | 0 |
The above table is the Health ,safety and Environment stats for a store with two branches....
I need to represent the data in a pyramid form and a bar chart form.. see attached for clarity..
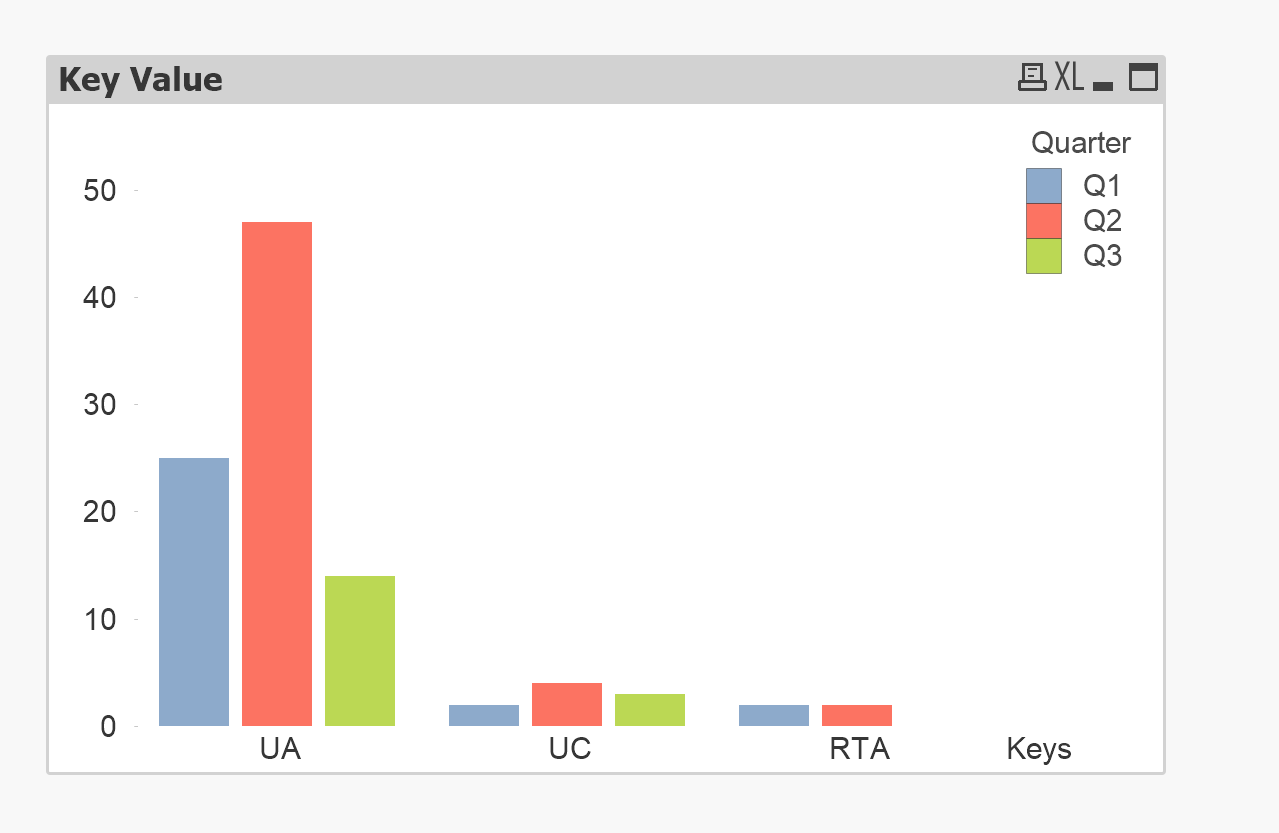
I don't know how to manipulate the data (using UA, UC as dimension and Quarter as Measures) see picture
thanks


- « Previous Replies
-
- 1
- 2
- Next Replies »

 Digvijay_Singh
- Mark as New
- Bookmark
- Subscribe
- Mute
- Subscribe to RSS Feed
- Permalink
- Report Inappropriate Content
Check this may be -

- Mark as New
- Bookmark
- Subscribe
- Mute
- Subscribe to RSS Feed
- Permalink
- Report Inappropriate Content
yes off course, crosstable load is also an option... but the table must be in a specific format as we know 
TEMP:
LOAD * INLINE [
Location, Year, Quarter, UA, UC, RTA
Area 1, 2015, Q1, 12, 1, 2
Area 2, 2015, Q1, 13, 1, 0
Area 1, 2015, Q2, 34, 2, 1
Area 2, 2015, Q2, 13, 2, 1
Area 1, 2015, Q3, 13, 1, 0
Area 2, 2015, Q3, 1, 2, 0
];
FINAL:
CrossTable(Type, Value, 3)
LOAD Location,
Quarter,
Year,
RTA,
UA,
UC
Resident TEMP;
DROP Table TEMP;
Digvijay_Singh
- Mark as New
- Bookmark
- Subscribe
- Mute
- Subscribe to RSS Feed
- Permalink
- Report Inappropriate Content
Yup, I agree.
akpofureenughwu
- Mark as New
- Bookmark
- Subscribe
- Mute
- Subscribe to RSS Feed
- Permalink
- Report Inappropriate Content
This is great with the use of crosstable I have managed to transfrom 4,000 lines of data ( automatically too).. but I need to sort my data from (highest to lowest).. used expression.....
Pick(Match(ValueList('UA','UC','RTA'),'UA','UC','RTA'),Sum({<Key={'UA'}>}Value),Sum({<Key={'UC'}>}Value),Sum({<Key={'RTA'}>}Value))
but there was not change?
Thanks
- « Previous Replies
-
- 1
- 2
- Next Replies »