Unlock a world of possibilities! Login now and discover the exclusive benefits awaiting you.

- Qlik Community
- :
- All Forums
- :
- QlikView
- :
- Re: Date Island Issue
- Subscribe to RSS Feed
- Mark Topic as New
- Mark Topic as Read
- Float this Topic for Current User
- Bookmark
- Subscribe
- Mute
- Printer Friendly Page

 qliksus
- Mark as New
- Bookmark
- Subscribe
- Mute
- Subscribe to RSS Feed
- Permalink
- Report Inappropriate Content
Date Island Issue
Hi All,
I have set of data on which i want to see the sales by Month , for the first 6 months would be Sum of Sales and rest of 6 months output would be sum of last 3 months.
Input Data:
| Date | Sale |
|---|---|
| 31/01/2016 | 100 |
| 29/02/2016 | 110 |
| 31/03/2016 | 120 |
| 30/04/2016 | 130 |
| 31/05/2016 | 140 |
| 30/06/2016 | 150 |
| 31/07/2016 | 160 |
| 31/08/2016 | 170 |
| 30/09/2016 | 180 |
| 31/10/2016 | 190 |
| 30/11/2016 | 200 |
| 31/12/2016 | 210 |
OutPut:
| Report_Date | Output |
|---|---|
| 31/01/2016 | 100 |
| 29/02/2016 | 110 |
| 31/03/2016 | 120 |
| 30/04/2016 | 130 |
| 31/05/2016 | 140 |
| 30/06/2016 | 150 |
| 31/07/2016 | 420 |
| 31/08/2016 | 450 |
| 30/09/2016 | 480 |
| 31/10/2016 | 510 |
| 30/11/2016 | 540 |
| 31/12/2016 | 570 |
I have tried using Date Island but no luck. Can anyone help me resolve it?

 sunny_talwar
- Mark as New
- Bookmark
- Subscribe
- Mute
- Subscribe to RSS Feed
- Permalink
- Report Inappropriate Content
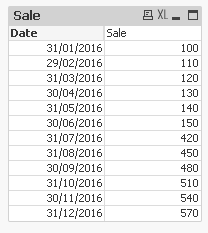
May be this:
If(RowNo() <= 6, Sum(Sale), RangeSum(Above(Sum(Sale), 1, 3)))
qliksus
- Mark as New
- Bookmark
- Subscribe
- Mute
- Subscribe to RSS Feed
- Permalink
- Report Inappropriate Content
Many Thanks Sunny, Range sum won't work here as the base line data is stored in little bit different way. I want to achieve the same using Date Island in Set analysis. let me show you the underline data as
| Date | Category | Sale |
|---|---|---|
| 31/01/2016 | A | 100 |
| 31/01/2016 | B | 310 |
| 29/02/2016 | A | 110 |
| 29/02/2016 | B | 320 |
| 31/03/2016 | A | 120 |
| 31/03/2016 | B | 330 |
| 30/04/2016 | A | 130 |
| 30/04/2016 | B | 340 |
| 31/05/2016 | A | 140 |
| 31/05/2016 | B | 350 |
| 30/06/2016 | A | 150 |
| 30/06/2016 | B | 370 |
| 31/07/2016 | A | 160 |
| 31/08/2016 | A | 170 |
| 30/09/2016 | A | 180 |
| 31/10/2016 | A | 190 |
| 30/11/2016 | A | 200 |
| 31/12/2016 | A | 210 |
We have 2 categories data as A & B, whereas A have all 12 month data and B have only 6 Month data. Basically we need to populate B's 6 month of data based on A's last 6 Month data. Hope it make more clear now
sunny_talwar
- Mark as New
- Bookmark
- Subscribe
- Mute
- Subscribe to RSS Feed
- Permalink
- Report Inappropriate Content
What is the expected output here?
qliksus
- Mark as New
- Bookmark
- Subscribe
- Mute
- Subscribe to RSS Feed
- Permalink
- Report Inappropriate Content
Hi Sunny,
Expected output is
| Date | Category | Sale | |
|---|---|---|---|
| 31/01/2016 | A | 100 | |
| 31/01/2016 | B | 310 | |
| 29/02/2016 | A | 110 | |
| 29/02/2016 | B | 320 | |
| 31/03/2016 | A | 120 | |
| 31/03/2016 | B | 330 | |
| 30/04/2016 | A | 130 | |
| 30/04/2016 | B | 340 | |
| 31/05/2016 | A | 140 | |
| 31/05/2016 | B | 350 | |
| 30/06/2016 | A | 150 | |
| 30/06/2016 | B | 370 | |
| 31/07/2016 | A | 160 | |
| 31/08/2016 | A | 170 | |
| 30/09/2016 | A | 180 | |
| 31/10/2016 | A | 190 | |
| 30/11/2016 | A | 200 | |
| 31/12/2016 | A | 210 | |
| B | 420 | |
| 31/08/2016 | B | 450 | |
| 30/09/2016 | B | 480 | |
| 31/10/2016 | B | 510 | |
| 30/11/2016 | B | 540 | |
| 31/12/2016 | B | 570 |
sunny_talwar
- Mark as New
- Bookmark
- Subscribe
- Mute
- Subscribe to RSS Feed
- Permalink
- Report Inappropriate Content
Are there only 2 categories? what happens when there is a third category? 2 of them have values and 1 don't or 1 of them have values and 2 don't. I am confused how this is expanded in your actual dashboard.
qliksus
- Mark as New
- Bookmark
- Subscribe
- Mute
- Subscribe to RSS Feed
- Permalink
- Report Inappropriate Content
Hi,
Always there have to be only 2 categories, A should have 12 Month data and B have partial. B's missing month value should be derived based on A's value [ Sum of last 3 Month].
e:g: In case of July-2016, B's value would be sum of A's [Jun-2016 , May-2016, Apr-2016].
Hope you are clear now.
sunny_talwar
- Mark as New
- Bookmark
- Subscribe
- Mute
- Subscribe to RSS Feed
- Permalink
- Report Inappropriate Content
Try this:
=Aggr(If(Sum(Sale) = 0, RangeSum(Above(Aggr(Alt(Above(Sum(Sale)), Below(Sum(Sale))), Date, Category), 1, 3)), Sum(Sale)), Category, Date)
