Unlock a world of possibilities! Login now and discover the exclusive benefits awaiting you.
- Qlik Community
- :
- All Forums
- :
- QlikView
- :
- Dates issue revisited
- Subscribe to RSS Feed
- Mark Topic as New
- Mark Topic as Read
- Float this Topic for Current User
- Bookmark
- Subscribe
- Mute
- Printer Friendly Page
- Mark as New
- Bookmark
- Subscribe
- Mute
- Subscribe to RSS Feed
- Permalink
- Report Inappropriate Content
Dates issue revisited
Hi all,
I wondered if anyone had come up with a better solution for the problem of visualising data with dates on a chart.
The situation I'm talking about is where you want to show data for a time period, e.g. a week, where you want Monday-Sunday displayed but you only have data for Mon, Wed, Thurs. Obviously, this problem is extended to days of the year, months etc...
Normally we create a calendar table that doesn't link, using this date as the dimension and then an expression like:
SUM ( IF(trans_date = calendar_date, SALES))
This works fine for smaller data sets. When the data set grows and the calculations become more complex, an IF statement here that essentially forces a join is VERY slow and renders some applications unusable.
This is something that I want to do all the time. In this example I would never want a chart that just showed Mon, Wed, Thurs, I would want to display every day of that week but only have bars (if it were a bar chart) on the days where there were sales.
If anyone has a slick, well performing solution I'd love to hear it!
Thanks
Gareth
ps - i realise this has been discussed a lot but to my mind no usable solution has been found for larger data sets.
- « Previous Replies
-
- 1
- 2
- Next Replies »
- Mark as New
- Bookmark
- Subscribe
- Mute
- Subscribe to RSS Feed
- Permalink
- Report Inappropriate Content
I would suggest you a master calendar. this is how solved this problem and it also works with a lot of data very well.
http://community.qlik.com/qlikviews/1001 i used this one and modeled it for my needs.
Hope this helps.
regards,
MT
- Mark as New
- Bookmark
- Subscribe
- Mute
- Subscribe to RSS Feed
- Permalink
- Report Inappropriate Content
I appreciate the link.
Unfortunately, this works because the data has data for every day in the calendar. If you knock out a day (e.g. 05/08/10) and then create a chart, the axis simply skips from 05/07/10 to 05/09/10. I want to, in this scenario, have 05/08/10 present on the x-axis but with no bar showing.
Hope that makes sense?
Thanks.
Gareth
- Mark as New
- Bookmark
- Subscribe
- Mute
- Subscribe to RSS Feed
- Permalink
- Report Inappropriate Content
yes you make sense, but thats what the mastercalendar is for to have every date. i need a lil bit more input for you problem i might can help you out.
What dimensions has your chart?
What formular are you using?
What is you selection?
regards,
MT
- Mark as New
- Bookmark
- Subscribe
- Mute
- Subscribe to RSS Feed
- Permalink
- Report Inappropriate Content
Yes I understand that every date is in the master calendar, so I use this date as my dimension.
Say I use an expression (on that QVW) of :
Count( [Order Number])
Then for the day I have knocked out (05/08/10) I have no data so I want a blank space, instead I get the date of 05/07/10, 05/09/10... so 05/08/10 is missing.
I try selection 'show zero values' and 'show all values' but this doesn't give me the desired result.
Does that make sense?
Thanks
Gareth
- Mark as New
- Bookmark
- Subscribe
- Mute
- Subscribe to RSS Feed
- Permalink
- Report Inappropriate Content
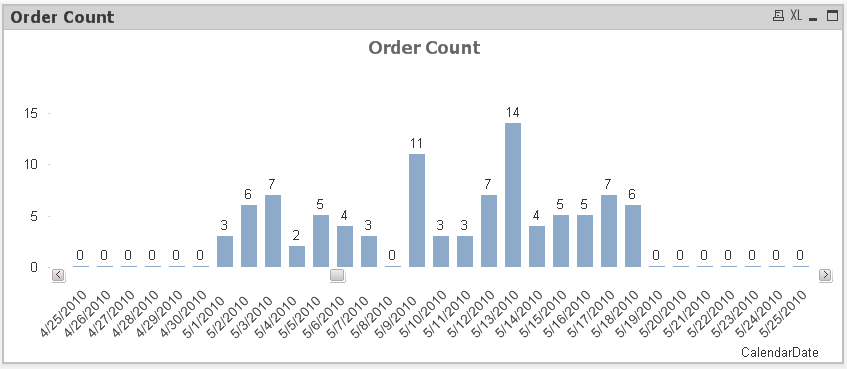
See my chart I have created in this calendard document. No 05/08/10 present and I can't get it to show on the chart.
Kind regards,
Gareth
- Mark as New
- Bookmark
- Subscribe
- Mute
- Subscribe to RSS Feed
- Permalink
- Report Inappropriate Content
ok...in the sheet presentation you can able and unable null-values excluded (smth like that Im not using qv in english)
the only problem now is that you see now all dates. but you can use a listbox for the month or year smth like that.
hope this helped a lil bit.
regards,
MT
- Mark as New
- Bookmark
- Subscribe
- Mute
- Subscribe to RSS Feed
- Permalink
- Report Inappropriate Content
Try adding 0.01 to the expression and setting the number format of the expression to integer. You should get something like this ...
... you can even set the little bar to white to hide it by using an expression in Background Color to ...
if(count([Order Number])=0,rgb(255,255,255))
flipside
- Mark as New
- Bookmark
- Subscribe
- Mute
- Subscribe to RSS Feed
- Permalink
- Report Inappropriate Content
Actually just selecting Continuous on the Axes tab should do what you need.
- Mark as New
- Bookmark
- Subscribe
- Mute
- Subscribe to RSS Feed
- Permalink
- Report Inappropriate Content
Thanks flipside and kbs,
This seems to be working a treat.
G
- « Previous Replies
-
- 1
- 2
- Next Replies »