Unlock a world of possibilities! Login now and discover the exclusive benefits awaiting you.
- Qlik Community
- :
- All Forums
- :
- QlikView
- :
- Dimension Limit, declining products
- Subscribe to RSS Feed
- Mark Topic as New
- Mark Topic as Read
- Float this Topic for Current User
- Bookmark
- Subscribe
- Mute
- Printer Friendly Page
- Mark as New
- Bookmark
- Subscribe
- Mute
- Subscribe to RSS Feed
- Permalink
- Report Inappropriate Content
Dimension Limit, declining products
Hi,
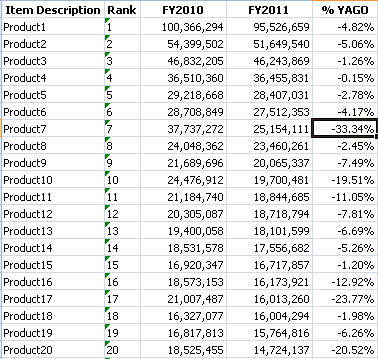
I want to have a chart that shows the declining products (negative %YAGO) and rank those products based on the current year sales. just like the screenshot: how can I do this in qlikview? please do help me.. Thanks a lot!
- « Previous Replies
-
- 1
- 2
- Next Replies »
- Mark as New
- Bookmark
- Subscribe
- Mute
- Subscribe to RSS Feed
- Permalink
- Report Inappropriate Content
Hi,
Use the below expression for rank
=Rank(-[FY2011]/[FY2010])
Or
Use Rank(-[% YAGO])
Do you mean rank based on the Current year sales the use sort by expression as
=Rank(Sum({<Year={$(=Max(Year))}>} Sales))
Hope it helps
Celambarasan
- Mark as New
- Bookmark
- Subscribe
- Mute
- Subscribe to RSS Feed
- Permalink
- Report Inappropriate Content
May be you can use RANK function on your sales field and then sort the table on ranked field.
Have i understood right?
Regards, tresesco
- Mark as New
- Bookmark
- Subscribe
- Mute
- Subscribe to RSS Feed
- Permalink
- Report Inappropriate Content
But how can I show only those products that have negative %YAGO?
- Mark as New
- Bookmark
- Subscribe
- Mute
- Subscribe to RSS Feed
- Permalink
- Report Inappropriate Content
Hi,
Use the Rank() to calculate rank for an expression.
Rank = Rank((Col(3) - Col(2))/Col(2))
OR
Rank = Rank(([FY2011] - [FY2010])/[FY2011])
If your expressions are dynamic then use first expression or else use the second one.
Hope this helps you.
Regards,
Jagan.
- Mark as New
- Bookmark
- Subscribe
- Mute
- Subscribe to RSS Feed
- Permalink
- Report Inappropriate Content
Hi,
Use the If condition in all the expressions
If([FY2011] - [FY2010] < 0, Your expression, 0)
If a row has all 0s then qlikview automatically removes those.
Regards,
Jagan.
- Mark as New
- Bookmark
- Subscribe
- Mute
- Subscribe to RSS Feed
- Permalink
- Report Inappropriate Content
so you mean i will use this as a calculated dimension: If([FY2011] - [FY2010] < 0, Your expression, 0)?
- Mark as New
- Bookmark
- Subscribe
- Mute
- Subscribe to RSS Feed
- Permalink
- Report Inappropriate Content
Hi,
This is not a calculated dimension
FY2011 - is your 2011 year expression
FY2010 - is your 2010 Year expression
In all the expressions which you have in your chart, first check it is negative value, if it negative then display as such or else just return 0 in If statement else condition.
If([FY2011Expression] - [FY2010Expression] < 0, Expression, 0)
Hope this helps you.
Regards,
Jagan.
- Mark as New
- Bookmark
- Subscribe
- Mute
- Subscribe to RSS Feed
- Permalink
- Report Inappropriate Content
Hi,
Can you attach the sample file.
Regards,
Jagan.
- Mark as New
- Bookmark
- Subscribe
- Mute
- Subscribe to RSS Feed
- Permalink
- Report Inappropriate Content
Sir,
attached is a sample file of my problem.
Thank you!
- « Previous Replies
-
- 1
- 2
- Next Replies »