Unlock a world of possibilities! Login now and discover the exclusive benefits awaiting you.

- Qlik Community
- :
- All Forums
- :
- QlikView
- :
- Re: Dynamic Grouping by Rank @Qlikview
- Subscribe to RSS Feed
- Mark Topic as New
- Mark Topic as Read
- Float this Topic for Current User
- Bookmark
- Subscribe
- Mute
- Printer Friendly Page

- Mark as New
- Bookmark
- Subscribe
- Mute
- Subscribe to RSS Feed
- Permalink
- Report Inappropriate Content
Dynamic Grouping by Rank @Qlikview
Hello everyone
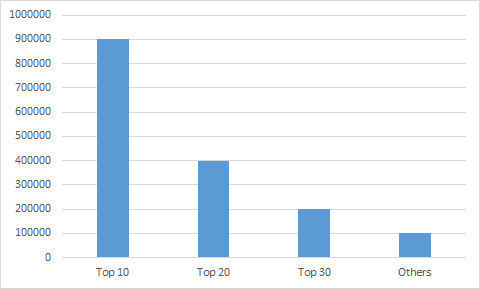
I have a problem with grouping of data. My idea is to show in a bar chart the revenues of Top 10, Top 20, and Top 30 etc companies.
Goal is to have a “clustered” output. As dimension, grouped companies (“Top 10”, “Top 20”, “Top 30”, …) would be perfect.
The data is structured as follows:
| Company | Revenue |
| A | 100 |
| A | 200 |
| B | 300 |
| C | 50 |
As example one of the used expressions:
“=if(Rank(Sum([Revenue]))<=20 and Rank(Sum([Revenue]))>10, sum([Revenue]))”
I tried the class function and worked with dynamic dimensions – nothing worked the way I wanted.
To guarantee dynamic selection I do not want to group it within the load script.
Thanks for any idea - wish you a great Sunday!
Example of the output needed:
Accepted Solutions
- Mark as New
- Bookmark
- Subscribe
- Mute
- Subscribe to RSS Feed
- Permalink
- Report Inappropriate Content
=AGGR(CLASS(RANK(SUM([Revenue])),10,SUM([Revenue])),Company)
It works - if there is another way how to handle it - I'd be happy for any suggestion!
Thanks
- Mark as New
- Bookmark
- Subscribe
- Mute
- Subscribe to RSS Feed
- Permalink
- Report Inappropriate Content
=AGGR(CLASS(RANK(SUM([Revenue])),10,SUM([Revenue])),Company)
It works - if there is another way how to handle it - I'd be happy for any suggestion!
Thanks
- Mark as New
- Bookmark
- Subscribe
- Mute
- Subscribe to RSS Feed
- Permalink
- Report Inappropriate Content
Hi,
Any chance of an example of this in a simple QV Document?
Thanks
- Mark as New
- Bookmark
- Subscribe
- Mute
- Subscribe to RSS Feed
- Permalink
- Report Inappropriate Content
Hi Tyrone,
i dont find the function to upload a QV document, so I attached some screenshots.
Its not the perfect way, but it will group the revenues of companies.
I used "Company" as list of company names and "Revenue" as the revenue of the company.
At the moment I dont have any access to my final document - just built you a fast example.
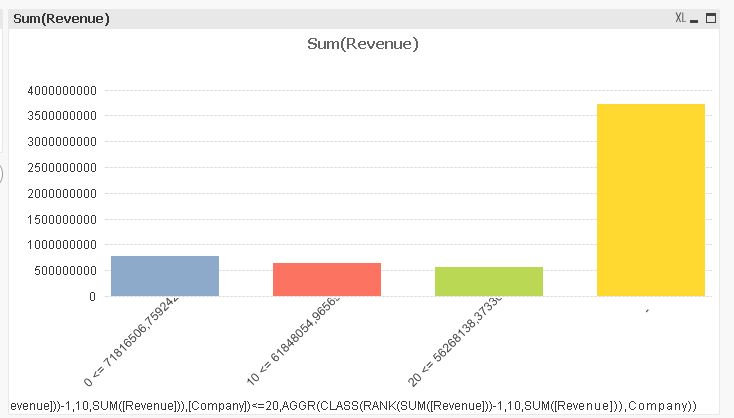
It will group the the Top 10, Top 20 and Top 30 companies and other companies as others.
Hope it helps.
Please define the dimension as =if(AGGR(CLASS(RANK(SUM([Revenue]))-1,10,SUM([Revenue])),[Company])<=20,AGGR(CLASS(RANK(SUM([Revenue]))-1,10,SUM([Revenue])),Company))
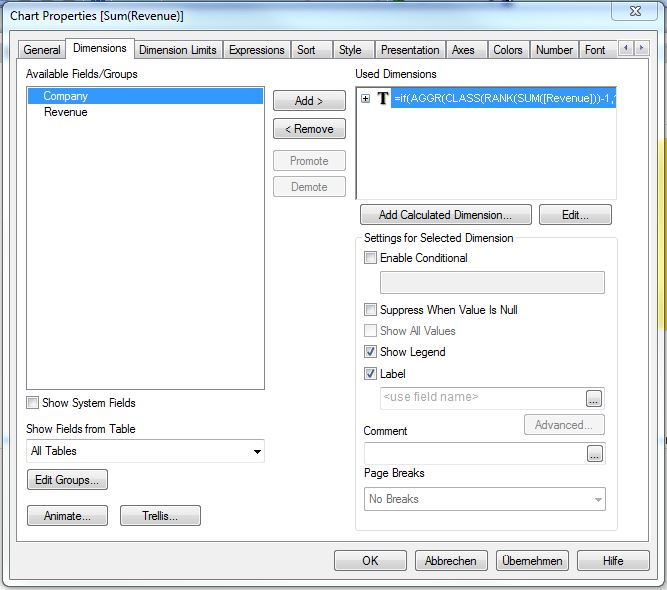
It will look like this:

The final result will look like this:
- Mark as New
- Bookmark
- Subscribe
- Mute
- Subscribe to RSS Feed
- Permalink
- Report Inappropriate Content
Thank you very much for the quick reply. I will go and see what damage I can do 