Unlock a world of possibilities! Login now and discover the exclusive benefits awaiting you.
- Qlik Community
- :
- All Forums
- :
- QlikView
- :
- Re: Exponential Forecast
- Subscribe to RSS Feed
- Mark Topic as New
- Mark Topic as Read
- Float this Topic for Current User
- Bookmark
- Subscribe
- Mute
- Printer Friendly Page
- Mark as New
- Bookmark
- Subscribe
- Mute
- Subscribe to RSS Feed
- Permalink
- Report Inappropriate Content
Exponential Forecast
Dear all
Can someone help to show me an example on how to write a script in expression for exponential foreast by months?.
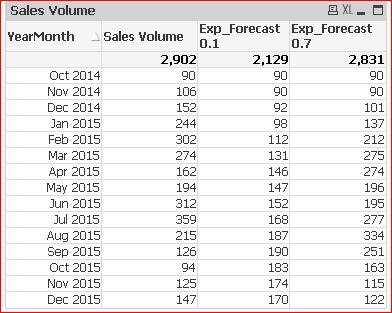
| YearMonth | Sales Volume | Exponential Forecast (0.1) | Exponential Forecast (0.7) |
| Oct-2014 | 90 | ||
| Nov-2014 | 106 | ||
| Dec-2014 | 152 | ||
| Jan-2015 | 244 | ||
| Feb-2015 | 302 | ||
| Mar-2015 | 274 | ||
| Apr-2015 | 162 | ||
| May-2015 | 194 | ||
| Jun-2015 | 312 | ||
| Jul-2015 | 359 | ||
| Aug-2015 | 215 | ||
| Sep-2015 | 126 | ||
| Oct-2015 | 94 | ||
| Nov-2015 | 125 | ||
| Dec-2015 | 147 |
Thank you very much
Tracy
- Tags:
- new_to_qlikview
- Mark as New
- Bookmark
- Subscribe
- Mute
- Subscribe to RSS Feed
- Permalink
- Report Inappropriate Content
Dear Sunny
Sorry, I do not know how to get the results, it was downloaded from SAP.
Tracy
- Mark as New
- Bookmark
- Subscribe
- Mute
- Subscribe to RSS Feed
- Permalink
- Report Inappropriate Content
Hi,
I don't understand, why the previous 2 rows coming under current. Anyhow, as i mentioned earlier, you can just use the previous() in script to get the 2 rows. And in in the expression use Peek().
Check the Attachment..
- Mark as New
- Bookmark
- Subscribe
- Mute
- Subscribe to RSS Feed
- Permalink
- Report Inappropriate Content
Dear Settu
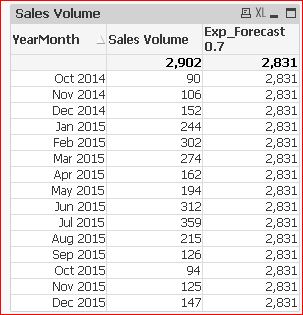
Please advise how to show just the highest total (2831) of Exp_Forecat in the chart (ie. 0.7) ?.
By the way, I failed to use the following in scrip, please help.
rangeavg(above(sum([Sales Volume])),-1,2))
Thank you
Tracy
- Mark as New
- Bookmark
- Subscribe
- Mute
- Subscribe to RSS Feed
- Permalink
- Report Inappropriate Content
Hi,
where do you want to show the total (2831) in the chart? generally you can use the expression.
=sum([Exp_Forecast(0.7)])
By the way, I failed to use the following in scrip, please help.
rangeavg(above(sum([Sales Volume])),-1,2))
there is one extra parenthesis..(not sure about the requirement)
rangeavg(above(sum([Sales Volume])),-1,2)
Can you post your qvw, and expected result?
- Mark as New
- Bookmark
- Subscribe
- Mute
- Subscribe to RSS Feed
- Permalink
- Report Inappropriate Content
Dear Settu
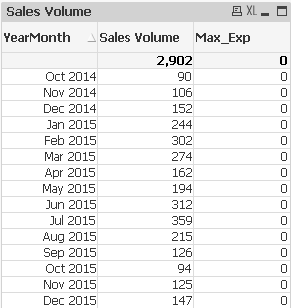
Instead of showing both Exp 0.1 & Exp 0.7 on the report, just display the one with MaxTotal.
YearMonth Sales Volume MaxTotal
Thank You
Tracy
- Mark as New
- Bookmark
- Subscribe
- Mute
- Subscribe to RSS Feed
- Permalink
- Report Inappropriate Content
Like This? If so, you can just use sum(TOTAL [Exp_Forecast(0.7)])
see attached..
- Mark as New
- Bookmark
- Subscribe
- Mute
- Subscribe to RSS Feed
- Permalink
- Report Inappropriate Content
Dear Settu
I would like to get the max between 0.1 & 0.7 or more variables in script instead of specifying 0.7 in sum Total,
Thank you
Tracy
- Mark as New
- Bookmark
- Subscribe
- Mute
- Subscribe to RSS Feed
- Permalink
- Report Inappropriate Content
Hi Tracy,
May be create one variable and assign the expression like below..
Variable Name : vMax_Forecast
Value : =if(sum(TOTAL [Exp_Forecast(0.1)]) > sum(TOTAL [Exp_Forecast(0.7)]),sum(TOTAL [Exp_Forecast(0.1)]),sum(TOTAL [Exp_Forecast(0.7)]))
- Mark as New
- Bookmark
- Subscribe
- Mute
- Subscribe to RSS Feed
- Permalink
- Report Inappropriate Content
Dear Settu
I had inserted Max_Exp in the script but nothing shown on table, please help.
if(RecNo()=1,[Sales Volume],
Num((1-$(vExp2))*Peek([Exp_Forecast(0.7)],RecNo()-2)+$(vExp2)*[Sales Volume],'#,##0')) as [Exp_Forecast(0.7)],
if(sum(TOTAL [Exp_Forecast(0.1)] ) > sum(TOTAL [Exp_Forecast(0.7)]),sum(TOTAL [Exp_Forecast(0.1)]),sum(TOTAL [Exp_Forecast(0.7)])) as Max_Exp
Resident T1 Order by YearMonth;
DROP Table T1;
Thank You
Tracy
- Mark as New
- Bookmark
- Subscribe
- Mute
- Subscribe to RSS Feed
- Permalink
- Report Inappropriate Content
Dear Settu
Please help on my request dated Feb 11, 2016.
Thank You
Tracy