Unlock a world of possibilities! Login now and discover the exclusive benefits awaiting you.

Announcements
Share your agentic AI experience, learn from others, and earn a new badge: Put Agentic AI to Work
- Qlik Community
- :
- All Forums
- :
- QlikView
- :
- Expression as Dimension
Options
- Subscribe to RSS Feed
- Mark Topic as New
- Mark Topic as Read
- Float this Topic for Current User
- Bookmark
- Subscribe
- Mute
- Printer Friendly Page
Turn on suggestions
Auto-suggest helps you quickly narrow down your search results by suggesting possible matches as you type.
Showing results for

Anonymous
Not applicable
2016-11-22
12:30 PM
- Mark as New
- Bookmark
- Subscribe
- Mute
- Subscribe to RSS Feed
- Permalink
- Report Inappropriate Content
Expression as Dimension
Hello,
I am trying to make this graph with the following data:
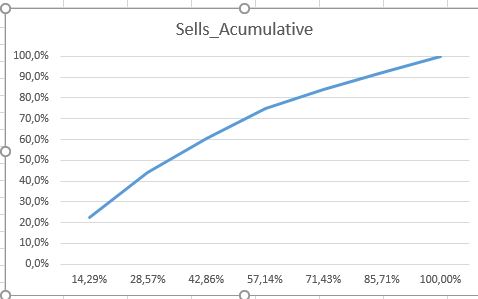
| Seller | Percent_of_Seller | Sells_Acumulative |
| a | 14,29% | 22,4% |
| b | 28,57% | 44,0% |
| c | 42,86% | 60,5% |
| d | 57,14% | 74,9% |
| e | 71,43% | 84,1% |
| f | 85,71% | 92,3% |
| g | 100,00% | 100,0% |
This is just an example, on my qlik file i have mucho more data, but i am interested in knowing how to do it.
Hope you can help me
730 Views
2 Replies
Anonymous
Not applicable
2016-11-22
12:34 PM
Author
- Mark as New
- Bookmark
- Subscribe
- Mute
- Subscribe to RSS Feed
- Permalink
- Report Inappropriate Content
use scatter chart
668 Views
Anonymous
Not applicable
2016-11-23
03:49 AM
Author
- Mark as New
- Bookmark
- Subscribe
- Mute
- Subscribe to RSS Feed
- Permalink
- Report Inappropriate Content
Hello,
Could you give some pointers?
Thank you
668 Views