Unlock a world of possibilities! Login now and discover the exclusive benefits awaiting you.
Announcements
ALERT: QlikView server communication interruptions following Microsoft Windows Domain Controller security updates
- Qlik Community
- :
- All Forums
- :
- QlikView
- :
- Re: Find ALL previous days sales
Options
- Subscribe to RSS Feed
- Mark Topic as New
- Mark Topic as Read
- Float this Topic for Current User
- Bookmark
- Subscribe
- Mute
- Printer Friendly Page
Turn on suggestions
Auto-suggest helps you quickly narrow down your search results by suggesting possible matches as you type.
Showing results for
Creator III
2018-09-27
01:46 PM
- Mark as New
- Bookmark
- Subscribe
- Mute
- Subscribe to RSS Feed
- Permalink
- Report Inappropriate Content
Find ALL previous days sales
Hello Team,
I have a data like below:
| Days | SALES |
|---|---|
| 1 | 10 |
| 2 | 5 |
| 3 | 15 |
| 4 | 20 |
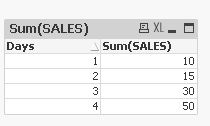
RESULTS:
| DAYS | SALES | ALL DAYS |
|---|---|---|
| 1 | 10 | 10 |
| 2 | 5 | 15(Previous days sales10+5) |
| 3 | 15 | 30(Previous days sales 10+5+15) same for others aswell |
| 4 | 20 | 50 |
703 Views
1 Solution
Accepted Solutions
Master II
2018-09-27
02:02 PM
- Mark as New
- Bookmark
- Subscribe
- Mute
- Subscribe to RSS Feed
- Permalink
- Report Inappropriate Content
Dimension = ID
Expression1 = sum(SALES)
Expression2 = Rangesum(above(sum(SALES),0,RowNo()))
649 Views
2 Replies
Master II
2018-09-27
02:02 PM
- Mark as New
- Bookmark
- Subscribe
- Mute
- Subscribe to RSS Feed
- Permalink
- Report Inappropriate Content
Dimension = ID
Expression1 = sum(SALES)
Expression2 = Rangesum(above(sum(SALES),0,RowNo()))
650 Views
MVP
2018-09-27
02:28 PM
- Mark as New
- Bookmark
- Subscribe
- Mute
- Subscribe to RSS Feed
- Permalink
- Report Inappropriate Content
Hi,
you could also use the standard "full accumulation" option in your chart properties:
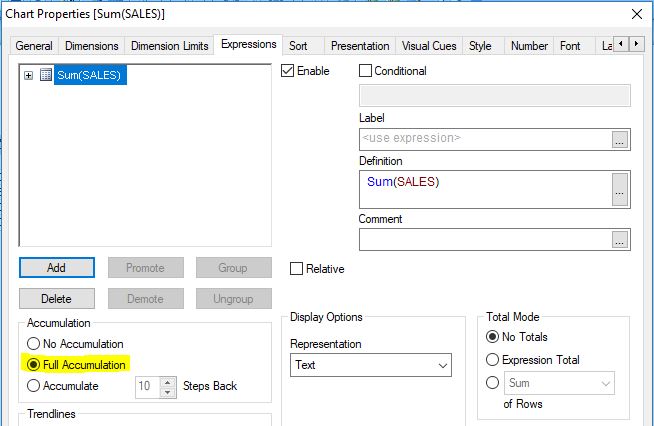
hope this helps
regards
Marco
649 Views