Unlock a world of possibilities! Login now and discover the exclusive benefits awaiting you.
- Qlik Community
- :
- All Forums
- :
- QlikView
- :
- Frame around plot area of chart
- Subscribe to RSS Feed
- Mark Topic as New
- Mark Topic as Read
- Float this Topic for Current User
- Bookmark
- Subscribe
- Mute
- Printer Friendly Page
- Mark as New
- Bookmark
- Subscribe
- Mute
- Subscribe to RSS Feed
- Permalink
- Report Inappropriate Content
Frame around plot area of chart
Hi,
sorry for this simple question but QV is pretty new for me!
I just want to do a coloured frame aound a chart in QV.
In the chart properties in tab colors the plot area border is always not selectable!
Does anybody know how this works?
Thanks for your help guys,
Christian
- Mark as New
- Bookmark
- Subscribe
- Mute
- Subscribe to RSS Feed
- Permalink
- Report Inappropriate Content
Hi Christian,
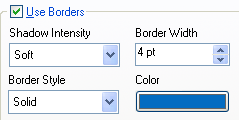
Do you mean borders? If so then you can right click on the chart, go to Properties--Layout tab, there in the top left section you can customize the borders as you want.
Hope this helps!
- Mark as New
- Bookmark
- Subscribe
- Mute
- Subscribe to RSS Feed
- Permalink
- Report Inappropriate Content
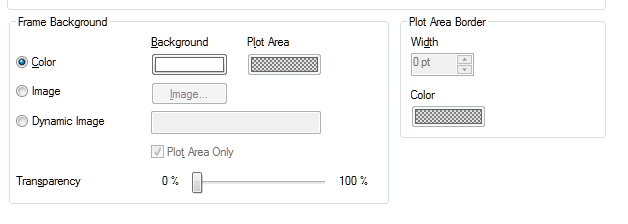
Right Click on chart --> Properties --> Colours..
You can specify colours and borders for the chart frame (Plot Area/Border is not available for all chart types, but Background Frame Colour is).
- Mark as New
- Bookmark
- Subscribe
- Mute
- Subscribe to RSS Feed
- Permalink
- Report Inappropriate Content
Hi Azam,
thanks for your help.
I use a normal bar chart. In the properties in tab colors I can just change the backround colour of the whole chart and not just the frame!
Is it really not possible to change such a simple thing?
thanks
Christian
- Mark as New
- Bookmark
- Subscribe
- Mute
- Subscribe to RSS Feed
- Permalink
- Report Inappropriate Content
Hi Syamal,
thanks fo your quik help.
Yes I mean exactly what you wrote me. The point is just, that I can not choose the colour of the border. I just can choose shodow intensity and border width. But then the border colour ist black and I would like to have it white!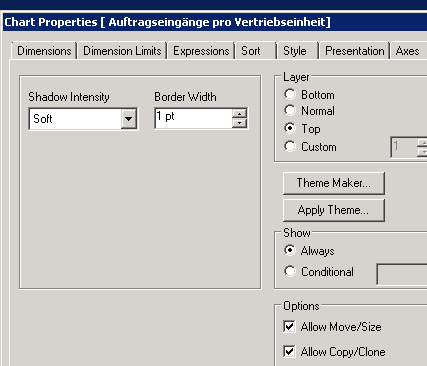
Cu,
Christian
- Mark as New
- Bookmark
- Subscribe
- Mute
- Subscribe to RSS Feed
- Permalink
- Report Inappropriate Content
Hi,
Hmmm. I've never actually used this before myself, but I had assumed that the 'Plot Area Border' would give you what you were after i.e. a border in your choice of colour. But I can't get it to work despite the help text implying that it should be available for a bar chart.
I know it's not the answer you're after, but there is a school of thought that suggests that frame borders and such like are in fact a waste of space and ink... they offer no extra information concerning the data at all.
Search for 'data ink ratio', or 'chart junk' if you want to learn more.
Azam
- Mark as New
- Bookmark
- Subscribe
- Mute
- Subscribe to RSS Feed
- Permalink
- Report Inappropriate Content
But,,,,
Go to Document Settings --> General Tab and set Styling Mode to Advanced. This will give you the option to specify a colour forborders in Chart Properties --> Layout as Shyamal suggests.

- Mark as New
- Bookmark
- Subscribe
- Mute
- Subscribe to RSS Feed
- Permalink
- Report Inappropriate Content
Hi Adam,
thanks so much. Now it works.
Thanks for your time!
CU
christian