Unlock a world of possibilities! Login now and discover the exclusive benefits awaiting you.
Announcements
Now accepting applications for the Qlik Luminary and Partner Ambassador Programs: Apply by July 6!
- Qlik Community
- :
- All Forums
- :
- QlikView
- :
- Gantt Chart axis and dates
Options
- Subscribe to RSS Feed
- Mark Topic as New
- Mark Topic as Read
- Float this Topic for Current User
- Bookmark
- Subscribe
- Mute
- Printer Friendly Page
Turn on suggestions
Auto-suggest helps you quickly narrow down your search results by suggesting possible matches as you type.
Showing results for
Not applicable
2015-06-12
01:04 PM
- Mark as New
- Bookmark
- Subscribe
- Mute
- Subscribe to RSS Feed
- Permalink
- Report Inappropriate Content
Gantt Chart axis and dates
Hi,
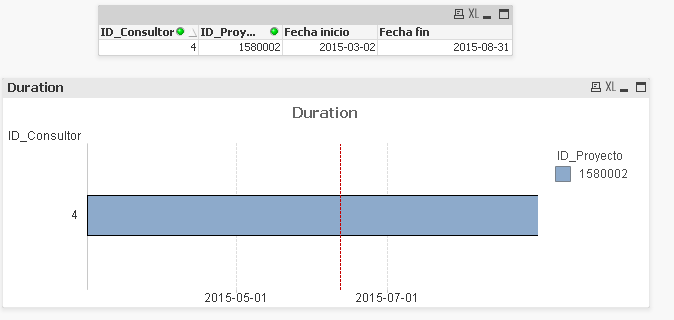
I want to make a Gantt chart like the example I'm attaching, but it is not working  the visualization is perfect but the dates showed on the graph are wrong, they don't make sense and also the axis isn't showing all the dates. Does anyone know what is happening or can anyone give me a hint of what to do?
Thank you very much.
942 Views
1 Reply
Champion III
2015-06-12
01:07 PM
- Mark as New
- Bookmark
- Subscribe
- Mute
- Subscribe to RSS Feed
- Permalink
- Report Inappropriate Content
Have you tried to follow:
744 Views