Unlock a world of possibilities! Login now and discover the exclusive benefits awaiting you.

- Qlik Community
- :
- All Forums
- :
- QlikView
- :
- Re: Gauge Chart Color coding
- Subscribe to RSS Feed
- Mark Topic as New
- Mark Topic as Read
- Float this Topic for Current User
- Bookmark
- Subscribe
- Mute
- Printer Friendly Page

 mhmmd_srf
- Mark as New
- Bookmark
- Subscribe
- Mute
- Subscribe to RSS Feed
- Permalink
- Report Inappropriate Content
Gauge Chart Color coding
Hi All,
I have a gauge chart where I am showing Actual Sales - Planned Sales.
And my Color coding is :
if Deviation <0, Red,
if Deviation = 0, Yellow,
if Deviation >0, Green.
But if deviation >0, then also the pointer is not going to Green area.
I am attaching my app. Could you please check and help me.
Thanks,
Sarif

 sunny_talwar
- Mark as New
- Bookmark
- Subscribe
- Mute
- Subscribe to RSS Feed
- Permalink
- Report Inappropriate Content
Your min and max are way too big
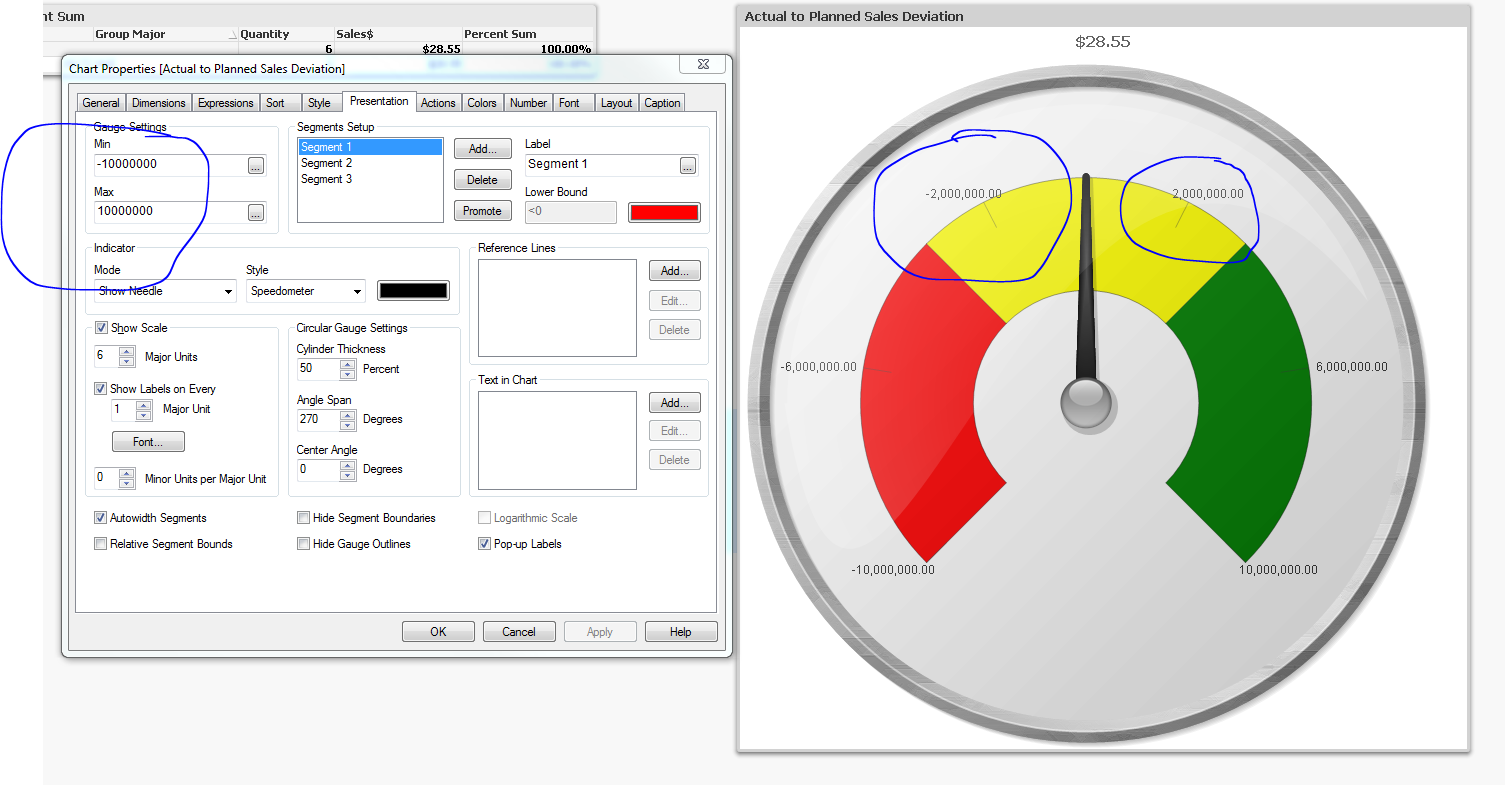
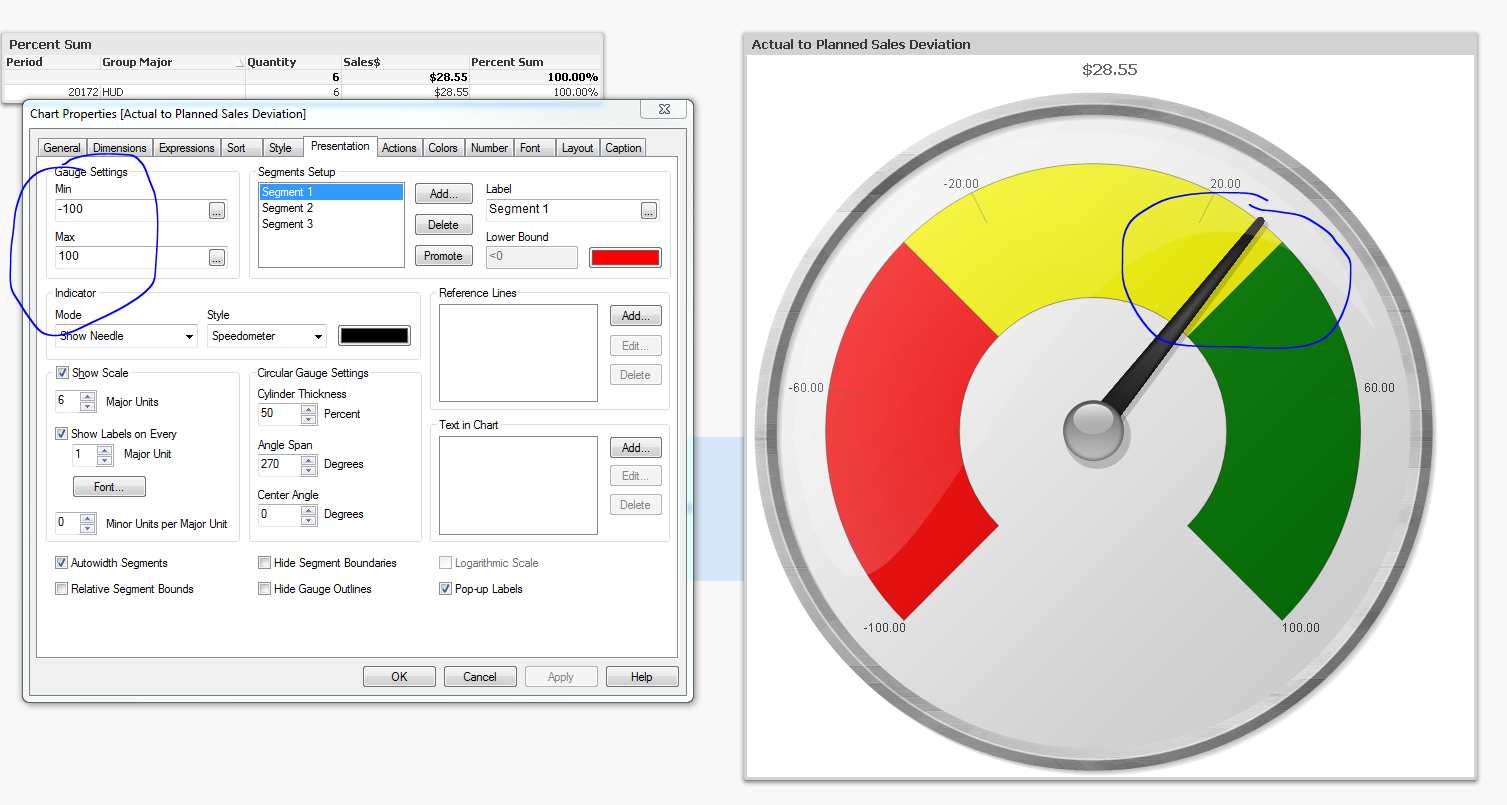
See what happen when I lower the number

- Mark as New
- Bookmark
- Subscribe
- Mute
- Subscribe to RSS Feed
- Permalink
- Report Inappropriate Content
Hi Sarif,
To display the Guage segments, you have to specify the minimum and maximum values with valid ones.
I have modified your QVW and attached below. Please find it and see the min and max values.
Note: 1) I have assumed sum(ContarctSales)>=0 and sum(PlannedSales)>=0 in your case. If it changes you have to change the condition for min and max values.
2) As Yellow = 0, it displays as the single line where red (<=0) and green(>=0) matches.