Unlock a world of possibilities! Login now and discover the exclusive benefits awaiting you.

- Qlik Community
- :
- All Forums
- :
- QlikView
- :
- Re: Gauge Chart help
- Subscribe to RSS Feed
- Mark Topic as New
- Mark Topic as Read
- Float this Topic for Current User
- Bookmark
- Subscribe
- Mute
- Printer Friendly Page

- Mark as New
- Bookmark
- Subscribe
- Mute
- Subscribe to RSS Feed
- Permalink
- Report Inappropriate Content
Gauge Chart help
Hi QV,
I'm having a problem with gauge chart, please help me out in this.
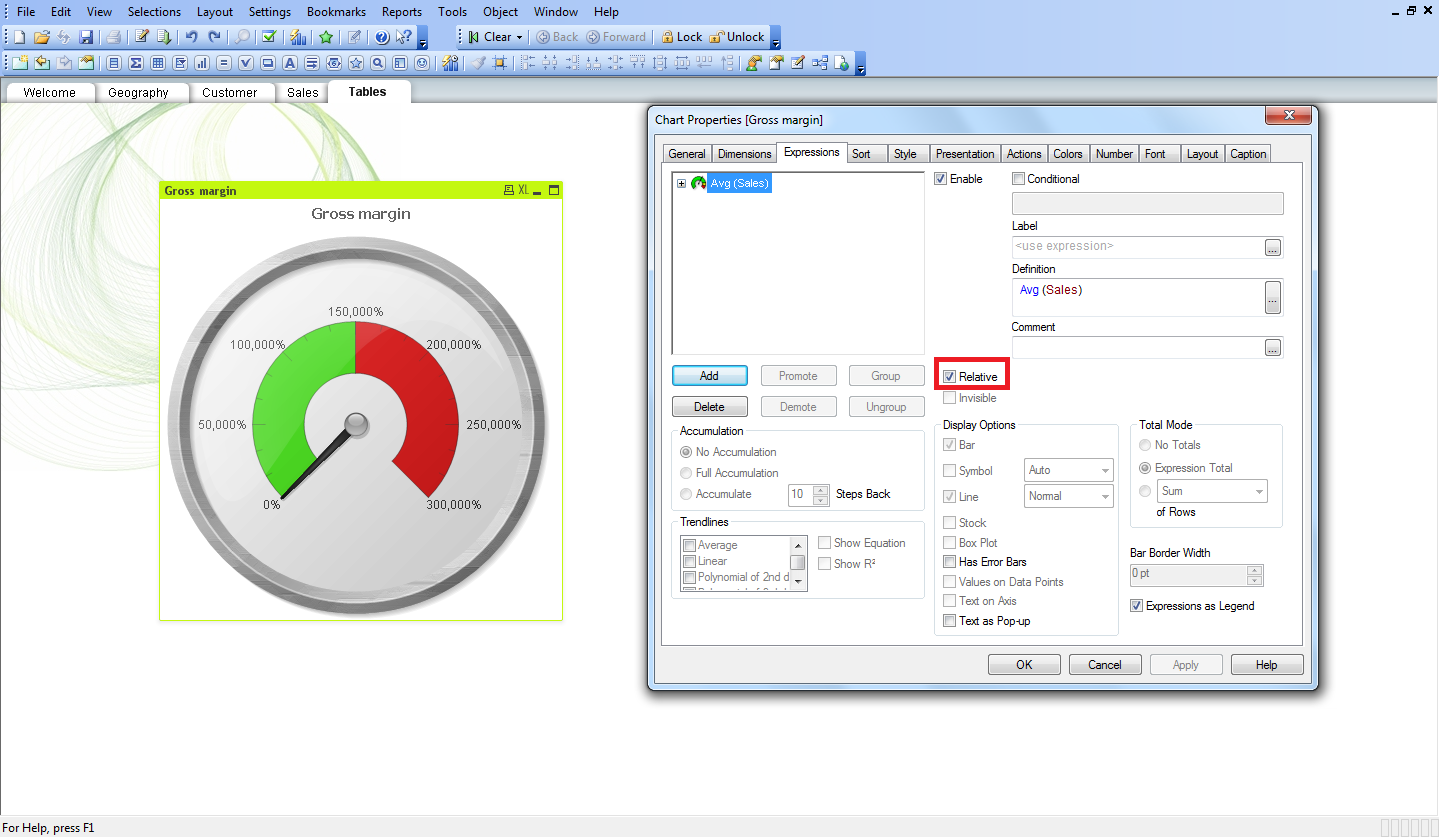
In the attached screen shot, How can I display %.
Right one is what my requirement in the image.
Thanks & Regards,
Ananth

- « Previous Replies
-
- 1
- 2
- Next Replies »

 dharmarasu
- Mark as New
- Bookmark
- Subscribe
- Mute
- Subscribe to RSS Feed
- Permalink
- Report Inappropriate Content
hi,
Add text in chart in the presentation tab wat u r wrote in the expression..
and then press ctrl+shift-> drag the object whereever u want..
hope this helps..
regards,
Dharma
- Mark as New
- Bookmark
- Subscribe
- Mute
- Subscribe to RSS Feed
- Permalink
- Report Inappropriate Content
Dear Ahmed, Many thanks for quick response, but the problem here is I'm using personal edition, So i couldn't be able to view the .qvw which u posted, If possible could u please post the steps.
Thanks
Ananth

 engishfaque
- Mark as New
- Bookmark
- Subscribe
- Mute
- Subscribe to RSS Feed
- Permalink
- Report Inappropriate Content
Dear Ananth,
Don't worry, I have attached screen shot for your quick understanding. Please check.
Kind regards,
Ishfaque Ahmed
- Mark as New
- Bookmark
- Subscribe
- Mute
- Subscribe to RSS Feed
- Permalink
- Report Inappropriate Content
Thanks to Community Members for quick responses. These are very helpful.
Thank you very much to one and all.
Regards,
Ananth
- « Previous Replies
-
- 1
- 2
- Next Replies »