Unlock a world of possibilities! Login now and discover the exclusive benefits awaiting you.

- Qlik Community
- :
- All Forums
- :
- QlikView
- :
- Re: Generate monthly historical data
- Subscribe to RSS Feed
- Mark Topic as New
- Mark Topic as Read
- Float this Topic for Current User
- Bookmark
- Subscribe
- Mute
- Printer Friendly Page

 rogeriobarbosa
- Mark as New
- Bookmark
- Subscribe
- Mute
- Subscribe to RSS Feed
- Permalink
- Report Inappropriate Content
Generate monthly historical data
Hello, I have this data table

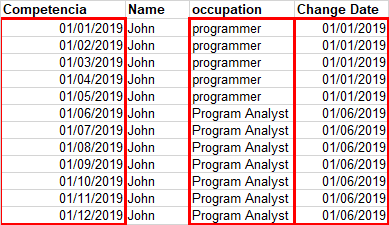
I want to generate monthly data observing the occupation change date, how to do it in the script so that I have this result:
Accepted Solutions

 skiruthigadevi
- Mark as New
- Bookmark
- Subscribe
- Mute
- Subscribe to RSS Feed
- Permalink
- Report Inappropriate Content
 otaviofs
- Mark as New
- Bookmark
- Subscribe
- Mute
- Subscribe to RSS Feed
- Permalink
- Report Inappropriate Content
Base:
LOAD
Name,
Occupation,
Change_Date as End,
date(if(Name=peek(Name),previous(Change_Date),yearstart(Change_Date))) as Start
;
LOAD * INLINE [
Name, Occupation, Change_Date
Jhon, Programmer, 01/03/2019
Jhon, Program Analyst, 15/06/2019
Jhon, Manager, 10/08/2019
];
Base_1:
Load
*,
date((Start +iterno()-1)) as Date
Resident Base
While Start +iterno()-1 < End;
drop table Base;

 Taoufiq_Zarra
- Mark as New
- Bookmark
- Subscribe
- Mute
- Subscribe to RSS Feed
- Permalink
- Report Inappropriate Content
can he have more than two occupations? or always 2 as in the example
Taoufiq ZARRA
"Please LIKE posts and "Accept as Solution" if the provided solution is helpful "
(you can mark up to 3 "solutions") 😉
skiruthigadevi
- Mark as New
- Bookmark
- Subscribe
- Mute
- Subscribe to RSS Feed
- Permalink
- Report Inappropriate Content
otaviofs
- Mark as New
- Bookmark
- Subscribe
- Mute
- Subscribe to RSS Feed
- Permalink
- Report Inappropriate Content
Base:
LOAD
Name,
Occupation,
Change_Date as End,
date(if(Name=peek(Name),previous(Change_Date),yearstart(Change_Date))) as Start
;
LOAD * INLINE [
Name, Occupation, Change_Date
Jhon, Programmer, 01/03/2019
Jhon, Program Analyst, 15/06/2019
Jhon, Manager, 10/08/2019
];
Base_1:
Load
*,
date((Start +iterno()-1)) as Date
Resident Base
While Start +iterno()-1 < End;
drop table Base;
