Unlock a world of possibilities! Login now and discover the exclusive benefits awaiting you.

- Qlik Community
- :
- All Forums
- :
- QlikView
- :
- Re: Graph shows different values when select a sin...
- Subscribe to RSS Feed
- Mark Topic as New
- Mark Topic as Read
- Float this Topic for Current User
- Bookmark
- Subscribe
- Mute
- Printer Friendly Page

- Mark as New
- Bookmark
- Subscribe
- Mute
- Subscribe to RSS Feed
- Permalink
- Report Inappropriate Content
Graph shows different values when select a single day
Hi All,
I don't know why my graph behaves the way it is and I hope that you can help me.
Below is my expression:
(Sum(total aggr( if(((Sum (met_sl))/(count(session_id)))>.8, 1,0),half_hr_bucket)))/48
And these are the results for each day from above expression when I select every single day from the selection.
| Date | Result |
| 7/1/2015 | 77% |
| 7/2/2015 | 67% |
| 7/3/2015 | 73% |
| 7/4/2015 | 69% |
| 7/5/2015 | 63% |
| 7/6/2015 | 73% |
| 7/7/2015 | 46% |
| 7/8/2015 | 56% |
I don't know why it does not show above results on graph, instead it shows 58% for all days.
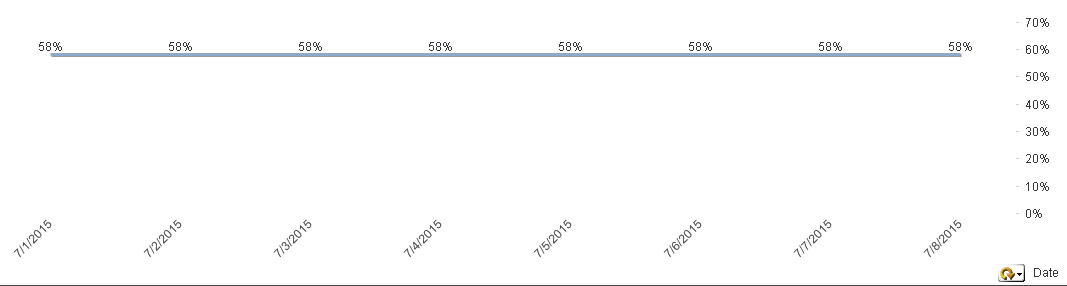
Your inputs are very much appreciated!
Thank you.

 parthakk
- Mark as New
- Bookmark
- Subscribe
- Mute
- Subscribe to RSS Feed
- Permalink
- Report Inappropriate Content
Hi Liam,
Can u attach qvw file?
Regards,
Partha Kulkarni

 sunny_talwar
- Mark as New
- Bookmark
- Subscribe
- Mute
- Subscribe to RSS Feed
- Permalink
- Report Inappropriate Content
Try this and see if the result changes:
=(Sum(TOTAL <Date> Aggr(If(((Sum(met_sl))/(Count(session_id)))>.8, 1, 0), half_hr_bucket)))/48
 Kushal_Chawda
- Mark as New
- Bookmark
- Subscribe
- Mute
- Subscribe to RSS Feed
- Permalink
- Report Inappropriate Content
Can you share the sample app?

 jonathandienst
- Mark as New
- Bookmark
- Subscribe
- Mute
- Subscribe to RSS Feed
- Permalink
- Report Inappropriate Content
You need the Date field in the Aggr() as it is the chart dimension, and I don't think you need the Total (hard to say without a sample):
=Sum(Aggr(If(Sum(met_sl)/Count(session_id) > 0.8, 1, 0), half_hr_bucket, Date)) / 48
Or
=Sum(TOTAL Aggr(If(Sum(met_sl)/Count(session_id) > 0.8, 1, 0), half_hr_bucket, Date)) / 48
- Mark as New
- Bookmark
- Subscribe
- Mute
- Subscribe to RSS Feed
- Permalink
- Report Inappropriate Content
@Jonathan Dienst: your first expression works! I do not know why the Total is the problem, would you please explain? Thank you.
@All: Thank you very much for your inputs