Unlock a world of possibilities! Login now and discover the exclusive benefits awaiting you.

- Qlik Community
- :
- All Forums
- :
- QlikView
- :
- Re: Has anyone created an ROC curve in qlikview be...
- Subscribe to RSS Feed
- Mark Topic as New
- Mark Topic as Read
- Float this Topic for Current User
- Bookmark
- Subscribe
- Mute
- Printer Friendly Page

 drohm002
- Mark as New
- Bookmark
- Subscribe
- Mute
- Subscribe to RSS Feed
- Permalink
- Report Inappropriate Content
Has anyone created an ROC curve in qlikview before? If so, how?
Has anyone created an ROC curve in qlikview before? If so, how?

 sunny_talwar
- Mark as New
- Bookmark
- Subscribe
- Mute
- Subscribe to RSS Feed
- Permalink
- Report Inappropriate Content
When you say ROC, you mean Return on Capital? Although I have not done, but do you have data to try it out?
drohm002
- Mark as New
- Bookmark
- Subscribe
- Mute
- Subscribe to RSS Feed
- Permalink
- Report Inappropriate Content
No, ROC stands for Receiver Operating Characteristic

 sunny_talwar
- Mark as New
- Bookmark
- Subscribe
- Mute
- Subscribe to RSS Feed
- Permalink
- Report Inappropriate Content
Hahahahaha, I have no idea what that is  ... can you share some data and the expected output?
drohm002
- Mark as New
- Bookmark
- Subscribe
- Mute
- Subscribe to RSS Feed
- Permalink
- Report Inappropriate Content
So I have field “ABC”, which contains the values 1 – 32. For each number, 1-32, I want to create a point on a chart, with an X and Y value. So the chart will have 32 points, and those points create a line which is an ROC curve. The X and Y values are two different fields, we can call them field X and field Y.


 ogautier62
- Mark as New
- Bookmark
- Subscribe
- Mute
- Subscribe to RSS Feed
- Permalink
- Report Inappropriate Content
Hi,
let's call :
vDiag : variable for the real diagnosis
vMeasure : the measure of the test
in dimension :
create a field (named Threashold) from min to max of variable measure with for example 100 rows :
that says if test considered to be negative or positive
in expression :
TP : true positive :
= sum(if($(vMeasure)>Threashold and $(vDiag) = 1,1,0))
FP : false positive :
= sum(if($(vMeasure)>Threashold and $(vDiag) = 0,1,0))
TN :true negative
= sum(if($(vMeasure)<=Threashold and $(vDiag) = 0,1,0))
FN :false negative
= sum(if($(vMeasure) <=Threasholdand $(vDiag) =1,1,0))
then sensitivity Se = TP/(TP+FN)
specificity = Sp = TN/(TN+FP)
1 - Specificity = 1 - TN/(TN+FP)
then export your sheet and reimport to create a new sheet with
Se in Y and 1-Sp in X : blue curve
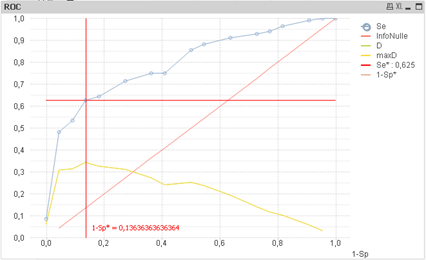
Optimum can be calculated as the maximum distance with the first bissector (y=x)
AUC (Aire Under the Curve) given by :
(if(rowno() = NoOfRows(),1,below([1-Sp]))- [1-Sp]) * (Se + ( if(rowno() = NoOfRows(),1, below(Se)) - Se)/2)
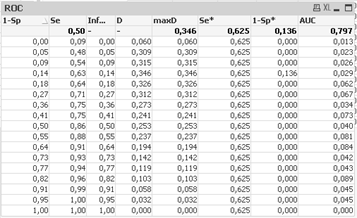
R gives the result : 0.799
regards

 hectorgarcia
- Mark as New
- Bookmark
- Subscribe
- Mute
- Subscribe to RSS Feed
- Permalink
- Report Inappropriate Content
do you have a qvw example with the concept you are explaining? Thanks
