Unlock a world of possibilities! Login now and discover the exclusive benefits awaiting you.
Announcements
Talend Cloud AWS EU Scheduled Outage: Starting Tues 26 May 21:00 CEST with expected completion Wed 27 May 01:00 CEST
- Qlik Community
- :
- All Forums
- :
- QlikView
- :
- Highlight Figures
Options
- Subscribe to RSS Feed
- Mark Topic as New
- Mark Topic as Read
- Float this Topic for Current User
- Bookmark
- Subscribe
- Mute
- Printer Friendly Page
Turn on suggestions
Auto-suggest helps you quickly narrow down your search results by suggesting possible matches as you type.
Showing results for
Creator II
2014-10-05
11:10 PM
- Mark as New
- Bookmark
- Subscribe
- Mute
- Subscribe to RSS Feed
- Permalink
- Report Inappropriate Content
Highlight Figures
Hi Friends
| FYear | 2012/2013 | 2013/2014 | |||||
| VEHICLE_TYPE | PAID_RANGE | CLAIM_PAID | CLAIM_NOS | PER_CLAIM_COST | CLAIM_PAID | CLAIM_NOS | PER_CLAIM_COST |
| CAR | <=10000 | 93,340,652 | 13,229 | 8,056 | 85,508,450 | 11,773 | 7,263 |
| CAR | 10,001-25,000 | 256,757,238 | 14,879 | 16,256 | 227,731,908 | 13,185 | 17,272 |
| CAR | 25,001-50,000 | 258,981,314 | 6,911 | 36,474 | 245,631,206 | 6,530 | 37,616 |
| CAR | 50,001-100,000 | 288,654,790 | 3,912 | 73,787 | 293,902,813 | 3,933 | 74,727 |
| CAR | 100,001-250,000 | 316,844,291 | 1,994 | 158,899 | 327,001,175 | 2,083 | 156,986 |
| CAR | 250,001-500,000 | 160,630,483 | 472 | 340,319 | 180,980,778 | 520 | 348,040 |
| CAR | 500,001-750,000 | 48,865,220 | 83 | 588,738 | 54,381,040 | 91 | 597,594 |
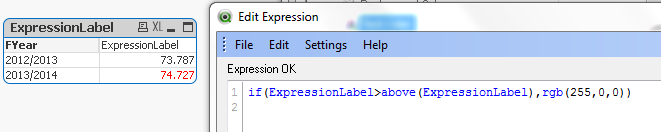
I have above pivot Table and I want to make the font color red in the last column if the per claim cost for 2013/14 is higher than the per claim cost for 2012/13 as highlighted in red by me . Pls help me how to to do it
454 Views
2 Replies
Specialist II
2014-10-06
12:31 AM
- Mark as New
- Bookmark
- Subscribe
- Mute
- Subscribe to RSS Feed
- Permalink
- Report Inappropriate Content
You could use one of the expressions before, first or above...to return the value of pivot cells:
e.g.:
Maybe you can attach your .qvw file to clarify the ideal expression
Master II
2014-10-06
01:01 AM
- Mark as New
- Bookmark
- Subscribe
- Mute
- Subscribe to RSS Feed
- Permalink
- Report Inappropriate Content
Hi Upali,
In your straight chart, in expression press  sign. You will get font color option.Write this condition over there.
If((2013/14_Perclaimcost>2012/13_Perclaimcost),rgb(255,0,0))
Regards
KC
Best Regards,
KC
KC
368 Views